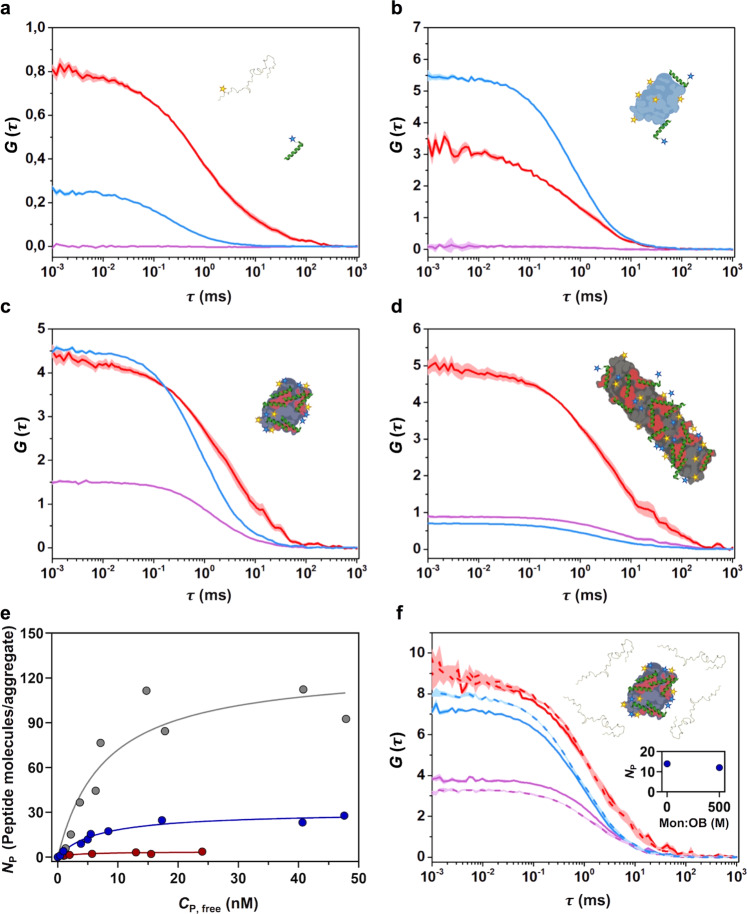
Fig. 2. Interaction of PSMα3 with different αS species by dcFCCS.
a–d Representative auto-correlation curves for α-synuclein (αS) (blue line) and PSMα3 (red line) and cross-correlation curves for interacting molecules (purple line). The amplitude (G) error is shown as faint colored area for the corresponding correlation curves. Samples contained (a) ~15 nM αS monomer and ~15 nM PSMα3, (b) 1 nM type A* and ~5 nM PSMα3, (c) 1 nM type B* oligomers and ~5 nM PSMα3 or (d) ~5 nM sonicated fibrils and ~5 nM PSMα3. e Titration binding curves for the interaction of PSMα3 with type A* oligomers (red circles), type B* oligomers (blue circles) or sonicated fibrils (gray circles) obtained by dcFCCS, showing their corresponding analysis assuming a model of n identical and independent binding sites (referred in equation 7 as Nmax) per αS aggregated species (solid lines). NP represents the number of bound peptides per aggregate. f Auto-correlation curves (αS in blue, PSMα3 peptide in red) and cross-correlation curve for the interacting molecules (in purple) obtained in samples containing ~1 nM αS type B* oligomers and ~2 nM PSMα3 in the absence (solid lines) or presence (dashed lines) of a 500-molar excess of unlabeled monomer with respect to the particle concentration of oligomers. The inset shows the number of bound peptides (NP) per aggregate in both conditions. For αS aggregated species, each consisting of several tens of monomers, the species concentrations are in the picomolar range and, as further explained above, single-particle conditions are ensured throughout the experiments.

