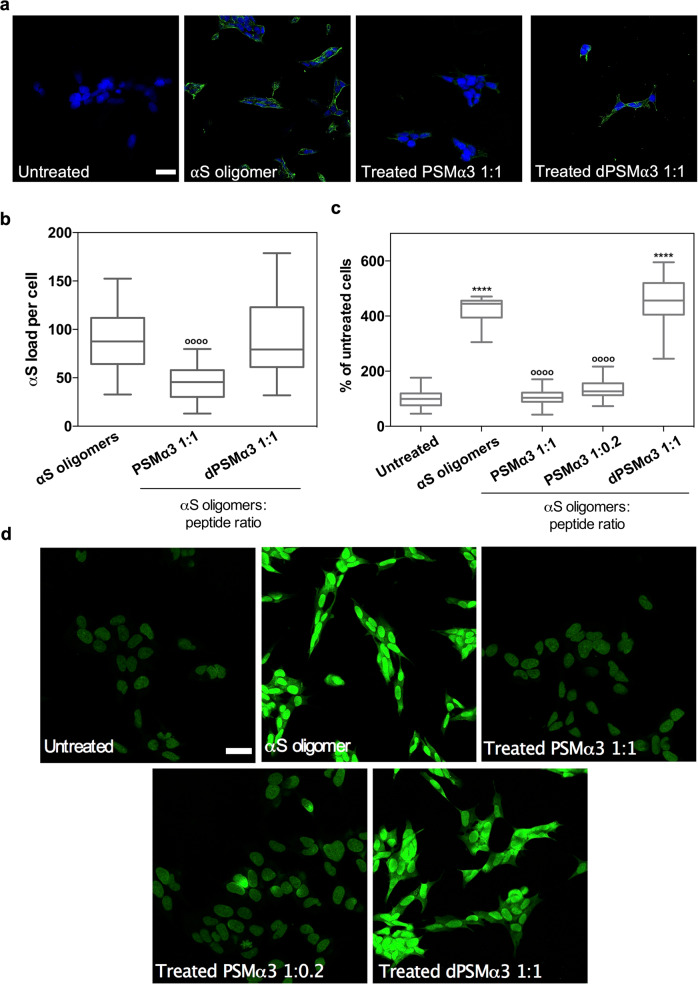
Fig. 4. Suppression of the αS oligomers-induced damage in neuroblastoma cells.
a Representative confocal images showing the α-synuclein (αS) load per cell after the treatment with 10 μM of type B* oligomers pretreated with an equimolar concentration of PSMα3 or dPSMα3. Scale bar represents 30 μm. b Quantification of the αS load per cell. ****p < 0.0001 relative to untreated cells. oooop < 0.0001 relative to cells treated with αS type B* oligomers. Unpaired two-tailed t tests (Welch-corrected). 76, 72, and 67 cells, (respectively, for αS oligomers, PSMα3 1:1, PSMα3 1:02 and dPSMα3) were analyzed from two independent experiments. c Quantification of the levels of intracellular ROS of SH-SY5Y cells incubated with 10 μM of type B* oligomers preincubated with different concentrations of PSMα3 or dPSMα3. oooop < 0.0001 relative to cells treated with αS type B* oligomers. (Unpaired two-tailed t tests (Welch-corrected)). 233, 230, 240, 212, and 100 cells, (respectively, for untreated, αS oligomers, PSMα3 1:1, PSMα3 1:02 and dPSMα3) were analyzed from two independent experiments d Representative confocal images of the analysis of panel (c). Scale bar represents 30 μM. In (b) and (c) data are represented as box and whiskers plots where the middle line is the median, the lower and upper hinges correspond to the first and third quartiles, the upper whisker extends from the hinge to the largest value no further than 1.5 × IQR from the hinge (where IQR is the inter-quartile range) and the lower whisker extends from the hinge to the smallest value at most 1.5 × IQR of the hinge.

