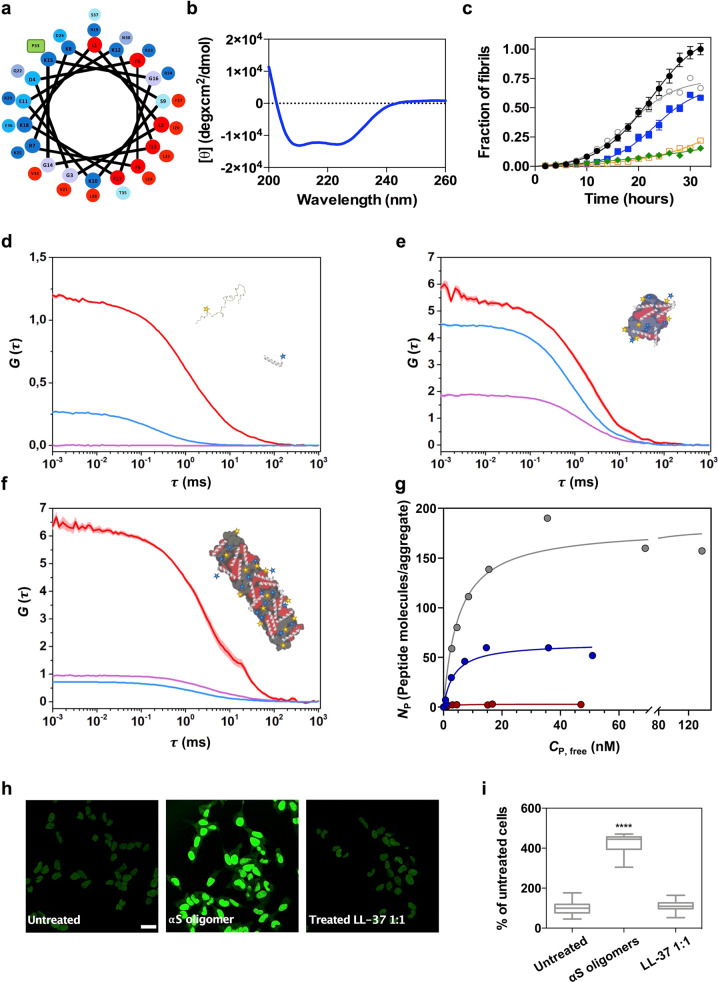
Fig. 6. Characterization of the interaction of LL-37 with the αS toxic species.
a Helical wheel projection of LL-37 sequence (red, hydrophobic residues; blue pallet, hydrophilic residues; green, proline). b Far-UV circular dichroism spectra of LL-37 in PBS pH 7.4. c Aggregation kinetics of 70 μM α-synuclein (αS) and titration of the inhibitory activity of LL-37 at different concentrations: 35 μM (green), 14 μM (orange), 7 μM (blue), 3.5 μM (gray) and in the absence of peptide (black). Data were expressed as mean ± s.e.m (n = 9 independent experiments). Representative auto-correlation curves for αS and LL-37 peptide and cross-correlation curves for interacting molecules are shown in blue, red and purple lines, respectively. The amplitude (G) error is shown as faint colored area for the corresponding correlation curves. Samples contained (d) ~15 nM αS monomers and ~15 nM LL-37, (e) 1 nM type B* oligomers and ~5 nM LL-37 or (f) ~5 nM sonicated fibrils and ~5 nM PSMα3. g Titration binding curves for the interaction of LL-37 with type A* oligomers (red circles), type B* oligomers (blue circles) or sonicated fibrils (gray circles) obtained by dcFCCS, showing their corresponding analysis assuming a model of n independent binding sites per αS aggregated species (solid lines). NP represents the number of bound peptides per aggregate. h Representative confocal images of SH-SY5Y cells treated with 10 μM of type B* oligomers in the presence of an equimolar concentration of LL-37. Scale bar represents 30 μm. i Quantification of the intracellular ROS of the experiment displayed in panel (h). ****p < 0.0001 relative to untreated cells. oooop < 0.0001 relative to cells treated with αS type B* oligomers. Unpaired two-tailed t tests (Welch-corrected). A total of 233, 230, and 199 cells, (respectively, for untreated αS oligomer and LL-37 1:1) were analyzed from two independent experiments. For αS aggregated species, consisting of several tens of monomers, the species concentrations in (d–g) are in the picomolar range and, as further explained above, single-particle conditions are ensured throughout the experiments. In (i) data are represented as box and whiskers plots where the middle line is the median, the lower and upper hinges correspond to the first and third quartiles, the upper whisker extends from the hinge to the largest value no further than 1.5 × IQR from the hinge (where IQR is the inter-quartile range) and the lower whisker extends from the hinge to the smallest value at most 1.5 × IQR of the hinge.

