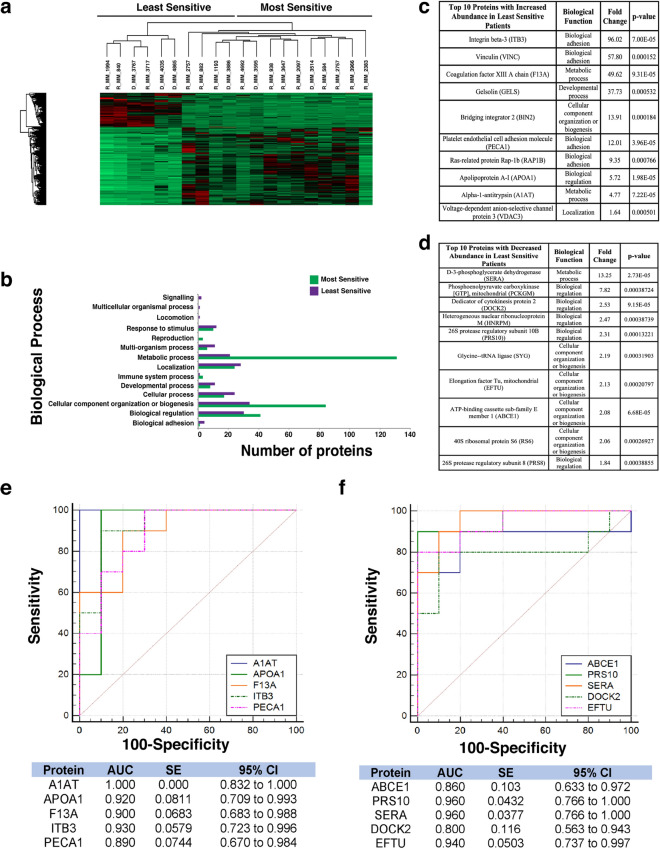
Figure 4.
Proteomic analysis of patients following PF-04691502 treatment. (a) Heatmap showing protein abundance changes of patients most and least sensitive to PF-04691502. Red indicates an increase in protein abundance, while green a decrease in protein abundance. (b) Graph showing the biological processes associated with the most and least sensitive patients. (c) List of the top ten proteins with increased abundance in the least sensitive patients. The associated biological function, fold change and p-value are also shown. Proteins were designated by p-value and arranged hierarchically by fold change. (d) List of the top ten proteins with decreased abundance in the least sensitive patients. The associated biological function, fold change and p-value are also shown. Proteins were designated by p-value and arranged hierarchically by fold change. (e) ROC analysis for top five statistically significant proteins with an increased abundance for the least sensitive patients to PF-04691502, including the calculated AUC, standard error (SE) and 95% confidence interval (CI). (f) ROC analysis for the top five statistically significant proteins with a decreased abundance for the least sensitive patients to PF-04691502, including the calculated AUC, standard error (SE) and 95% confidence interval (CI).

