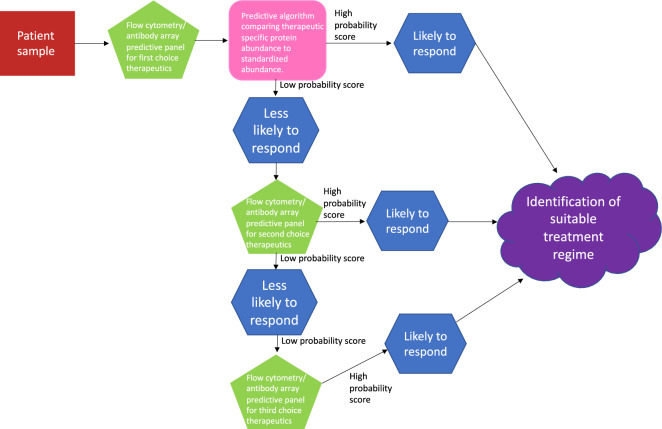
Figure 8.
Predictive panel flowchart. Figure depicts the path which clinical samples would take in determining the best choice of personalised treatment per patient, outlined in our manuscript. Decisions would be based on a predictive algorithm, where abundance levels for therapeutic specific proteins would be compared to standardised protein abundances, and a probability score provided. High probability score would indicate the patient would likely respond to the selected therapy, low probably would indicate the patient is less likely to respond to the selected therapy. This information is then used as part of the decision-making process around therapeutic choice. When a patient receives a low probability score for a specific therapy, other predictive panels could be investigated, to try and identify a specific therapy that would give a high probability score, helping with decision making.

