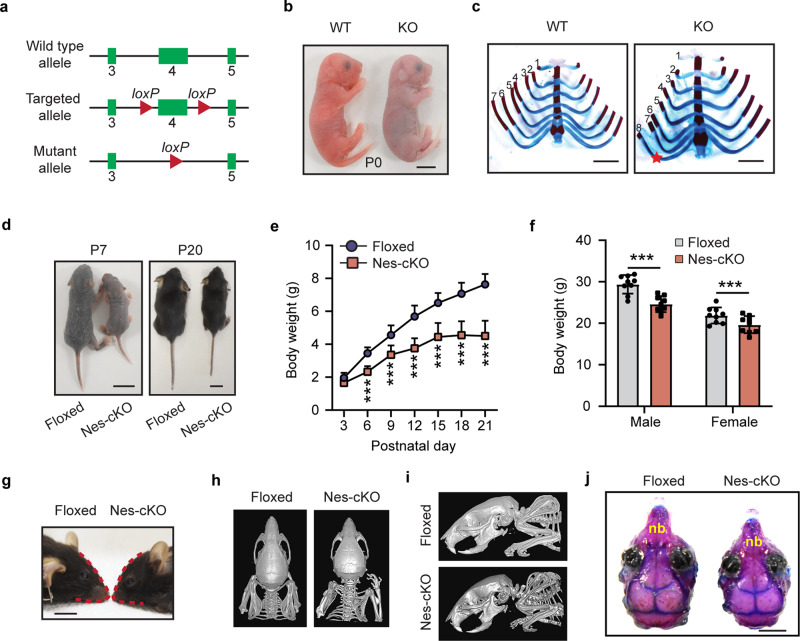
Fig. 1. Characterization of Ash1L knockout mice.
a Diagram showing the strategy for the generation of Ash1L conditional knockout mice. b Representative photos of wild-type and global Ash1L-KO newborns at P0. The Ash1L-KO newborns died at P0, bar = 5 mm. c Photos showing the ventral view of rib cages of wild-type and Ash1L-KO mice, bar = 2 mm. d Representative photos showing the body size of wild-type and Ash1L-Nes-cKO mice at P7 and P20, bar = 1 cm. e Postnatal growth curve of wild-type and Ash1L-Nes-KO mice before weaning. Mixed gender body weight was plotted. For each group, n = 15 mice. P-values calculated using a two-way ANOVA test. Error bars in graphs represent mean ± SEM. Note: **p < 0.01; ***p < 0.001. f Body weight of adult wild-type and Ash1L-Nes-cKO mice. All the mice were measured at 3-month old. For each group, n = 9 mice. P-values calculated using a two-way ANOVA test. Error bars in graphs represent mean ± SEM. Note: ***p < 0.001. g Photo showing the craniofacial deformity of Ash1L-Nes-cKO mice, bar = 5 mm. h–i A dorsal (h) and lateral (i) view of mouse skull shown by micro-CT scanning. j A dorsal view of skull shown by bone staining. nb, nose bone, bar = 2 mm.

