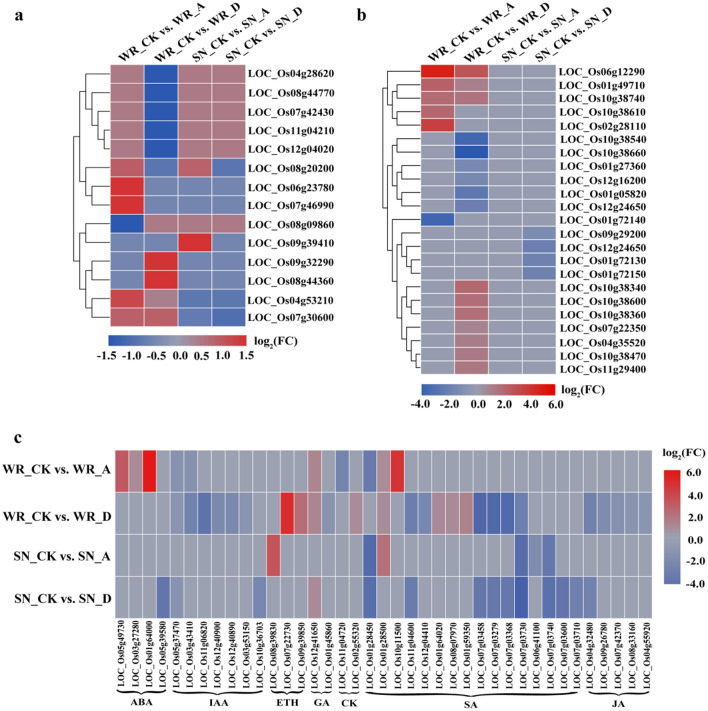
Figure 5.
DEGs relevant to peroxisome, glutathione metabolism, and hormone signaling after treatment with ABA or diniconazole. (a) Change in transcript expression levels associated with peroxisomes in WR04-6 and SN9816 plants after ABA and diniconazole treatment. (b) Expression patterns of genes involved in the glutathione metabolism pathway in the four pairwise transcriptome comparisons. (c) DEGs involved in hormone signaling in response to ABA and diniconazole treatment in WR04-6 and SN9816 plants. Gene expression levels were transformed by log2(FPKM) values. Red and blue represent up-regulation and down-regulation, respectively. A in WR_A or SN_A indicates ABA treatment, D in WR_D or SN_D indicates diniconazole treatment, and CK in WR_CK or SN_CK indicates the control group without treatment.

