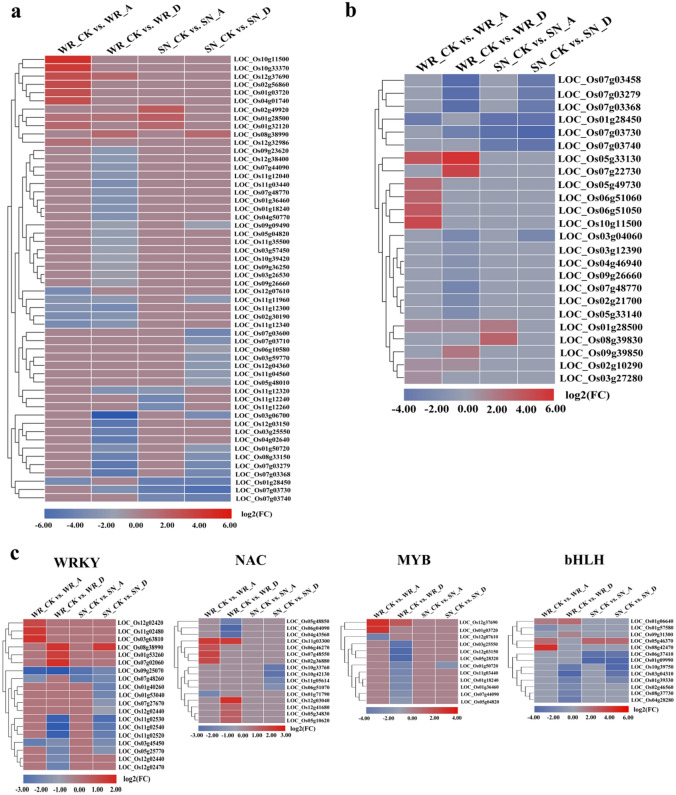
Figure 6.
Expression profiles of defense-related genes in WR04-6 and SN9816 plants after exogenous treatments. Comparative analysis of pathogen interactions (a), MAPK signaling pathway transduction (b), and the expression of transcription factor related genes (c) in WR04-6 and SN9816 plants after exogenous treatment. Gene expression levels were transformed by log2(FPKM) values. Red and blue represent up-regulation and down-regulation, respectively. A in WR_A or SN_A indicates ABA treatment, D in WR_D or SN_D indicates diniconazole treatment, and CK in WR_CK or SN_CK indicates the control group without treatment.

