Figure 6.
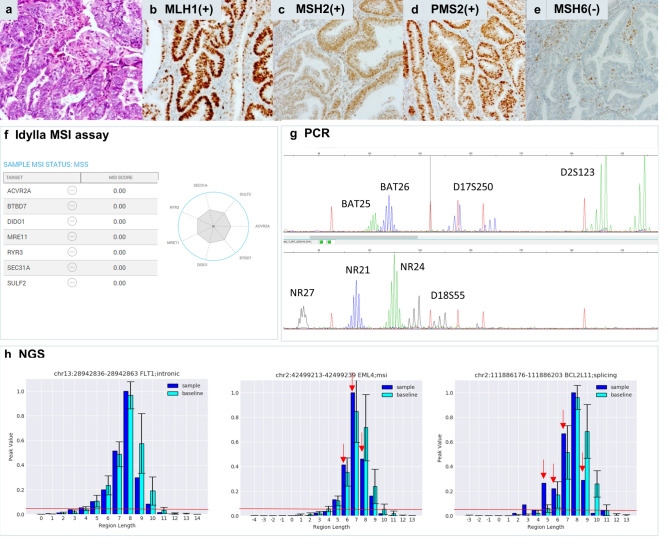
Endometrial dMMR/MSI tumor (case 45) with isolated loss of MSH6 expression, falsely negative by Idylla MSI assay, PCR and NGS. Hematoxylin eosin stain (a) of the tumor with classic morphology of endometrial adenocarcinoma (UCEC) with isolated loss of nuclear MSH6 (e) and preserved nuclear expression of MLH1 (b), MSH2 (c) and PMS2 (d). Idylla MSI assay (Idylla Explore software v.2.5.1294) (f) and PCR (GeneMapper v. 4.0 analysis software, Applied Biosystems). (g) called respectively 0/7 loci and 0/8 loci as MSS, resulting in MSS integrative result (Fig. 2). NGS (Python v.3.7 and Matplotlib 3.3.4 software) called 2/10 loci as unstable (Fig. 2) resulting in an overall MSS/0 score. Illustrative indel distribution plot of the FLT1, EML4 and BCL2L11 loci (h, from left to right) indicated identical number of integrated peaks (6/5/6 for respectively FLT1/ EML4/BCL2L11 loci) in tumor sample (dark blue bars) versus baseline (light blue bars) resulting in calling these loci as negative by the default mSINGS script. However, for the EML4 and BCL2L11 loci, the overall indel distribution did shift towards shorter indel lenghts as indicated by the red arrows, suggesting the presence of molecular alterations not recognized by the current parametrization of the script.

