Figure 3.
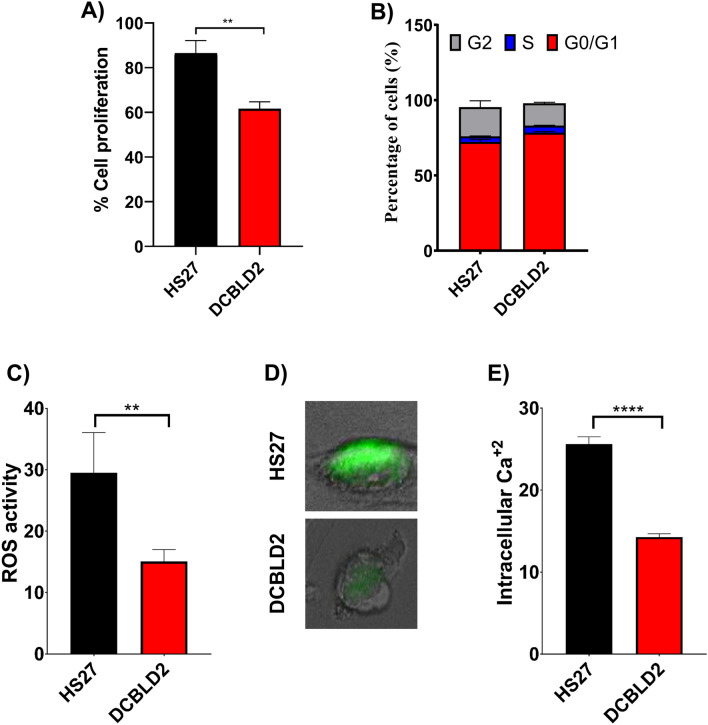
Functional characterization of the W27* variant in the DCBLD2 gene. (A) The rate of cell proliferation in patient and control fibroblasts determined by the MTT assay. A significant reduction in cell proliferation was observed for the index’s fibroblasts with W27* (P = 0.0054). Error bars refer to the standard error of the mean of five technical repeats and four independent biological experiments (n = 4). (B) Quantification of the cell cycle distribution of W27* and normal control cells. Index fibroblasts with the DCBLD2 W27* variant had slight prolongation of G1 phase. Error bars refer to the standard error of the mean of two biological repeats. Student’s t-test using GraphPad Prism software. (C) Quantitation of reactive oxygen species (ROS) in the proband’s fibroblasts with the nonsense mutation and normal control fibroblasts performed using the cell-permeable fluorogenic probe 2′,7′-dichlorodihydrofluorescein diacetate (p = 0.0015). Data are shown as the mean value ± SD, and five independent biological repeats were performed (n = 5). (D) Visualization and localization of the intracellular calcium level in a single cell from the patient’s and control fibroblasts. (E) Quantification of the intracellular Ca2 + level in the index’s fibroblasts with W27* compared to the normal control (p < 0.0001). Error bars refer to the standard error of the mean of five technical repeats and four independent biological experiments (n = 5).

