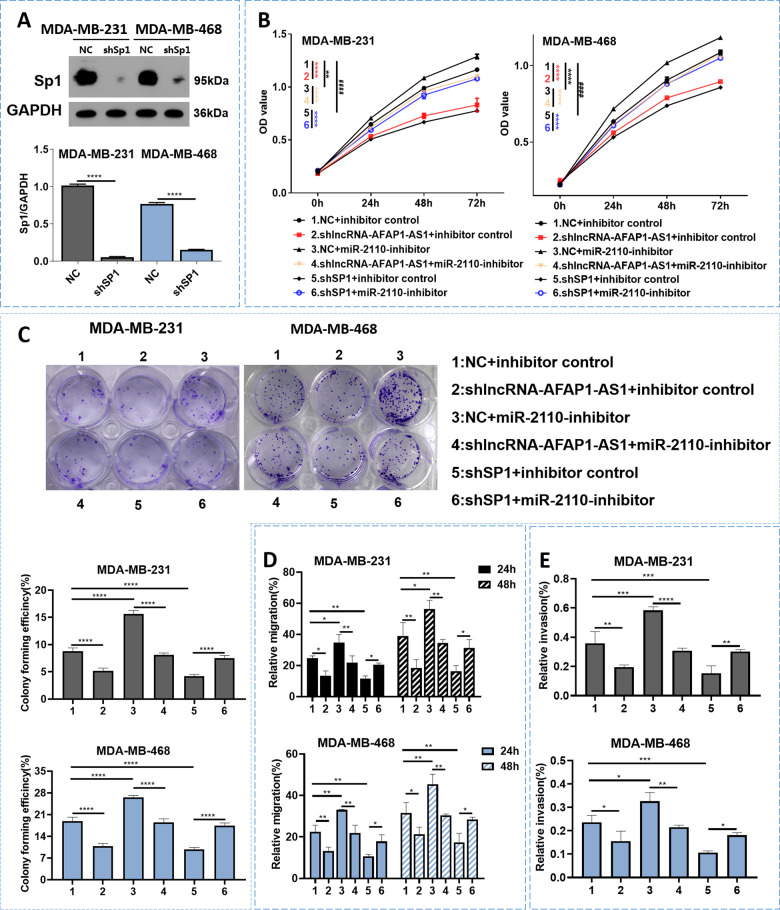
Fig. 4. AFAP1-AS1/miR-2110/Sp1 affected the proliferation, migration, and invasion of TNBC cells.
A Sp1 expression in MDA–MB-231 and MDA–MB-468 cells were examined through WB. B CCK-8 assay performed. Asterisks (*) and hash signs (#) represent the significant analysis between group 1 and group 2 (*), group 1 and group 3 (*), group 3 and group 4 (*), group 1 and group 5 (#), group 5 and group 6 (*), respectively. C Colony formation, D wound healing migration, and E Transwell assays performed after different treatment. Unpaired student’s t-test and one-way ANOVA test were used for the statistical analyses. *P < 0.05; **P < 0.01; ***P < 0.005; **** P < 0.001; ns not significant.

