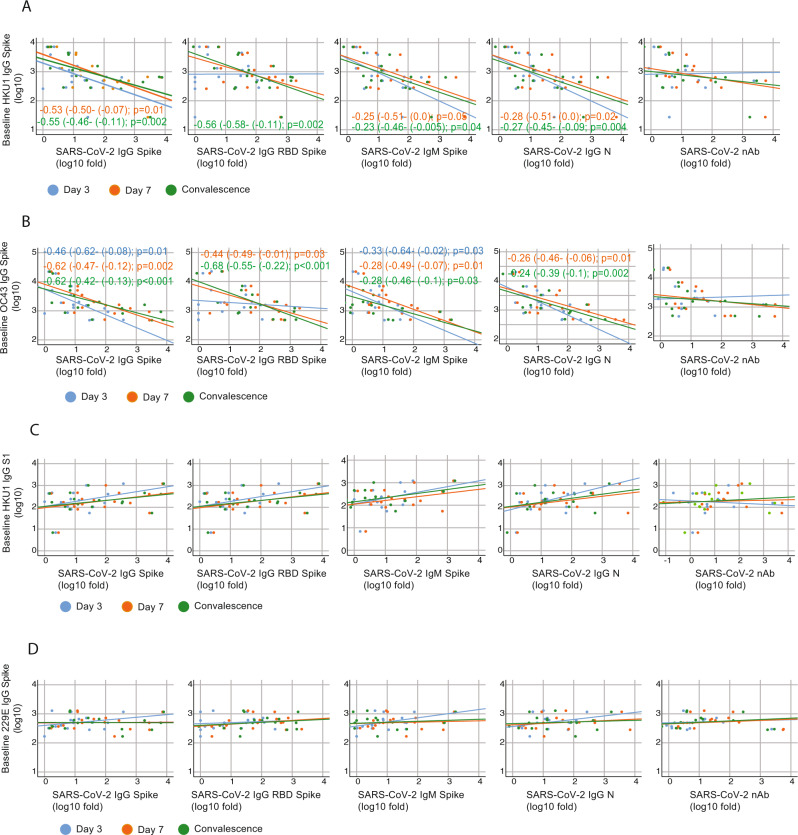
Fig. 6. Cross-reactivity with conserved epitopes against selected betacoronaviruses predicts negative influence on de novo anti-SARS-CoV-2 antibody responses.
A–D Scatterplot of baseline IgG levels for HKU1, OC43 and 229E S protein; and HKU1 S1 and fold induction of SARS-CoV-2 antibodies: neutralizing (nAb), IgG spike, IgG RBD, IgM spike, and nucleoprotein. Overlay shows relationship with induction of de novo antibodies against SARS-CoV-2 at each time point. Fitted linear regression and standardized beta coefficient (95% Confidence Interval, CI) for significant linear regressions are shown. Reported p values are based on two‐tailed tests.

