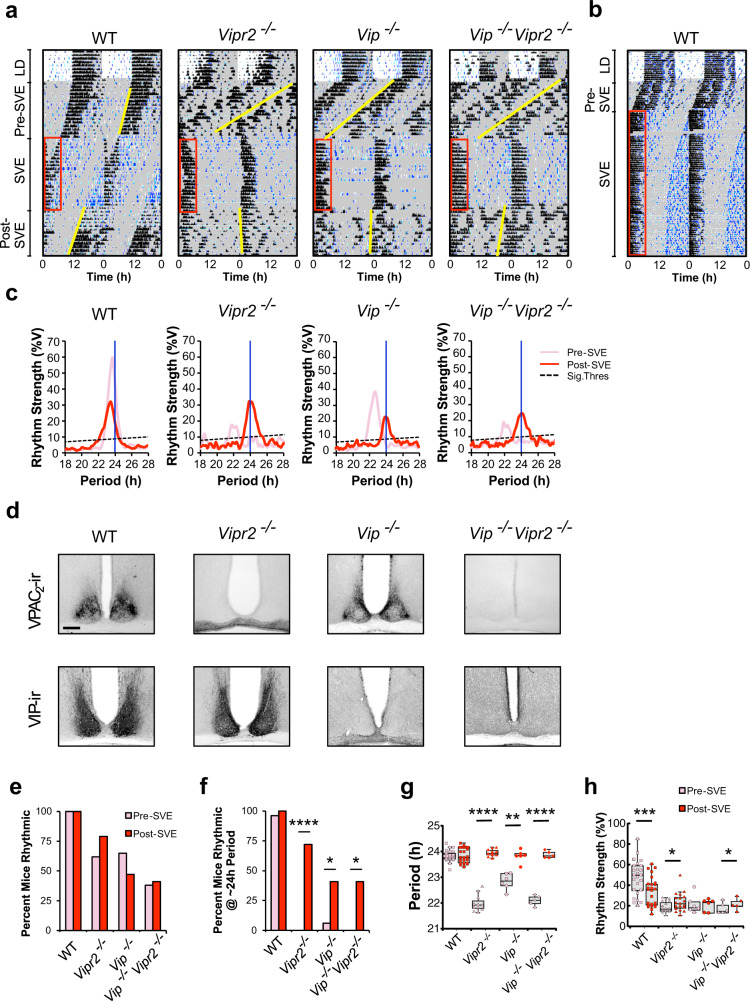
Fig. 1. Scheduled locomotor exercise promotes ~24 h behavioral rhythms in mice with disrupted VIP–VPAC2 signaling.
a Representative double-plotted actograms showing locomotor (black) and drinking (blue) activity for mice undergoing 3 weeks of scheduled voluntary exercise (SVE; n = 25, 39, 17 and 22, respectively). Shaded areas represent darkness. Red boxes indicate time of wheel availability during SVE and yellow lines mark onsets of activity pre- and post-SVE. b WT mice stably entrained to longer durations of SVE (also see Fig. S1f). c Chi2 periodograms showing dominant circadian period and rhythm strength of wheel-running activity pre-SVE (pink/light) and post-SVE (red/dark). Diagonal broken lines indicate significance threshold at p = 0.0001. Vertical blue lines indicate 24 h period for reference. d VIP and VPAC2 immunoreactivity in the SCN of wild-type (WT), Vipr2−/−, Vip−/−, and Vip−/−Vipr2−/− mice (scale bar: 200 µm). e, f Bar charts showing the percentage of rhythmic mice (e) and percentage of rhythmic mice with ~24 h period (f). g, h Dot plots overlaid on box plots show the period of wheel-running activity (g) and rhythm strength of wheel-running activity (h). Dots are the individual data points used in statistical analysis. Gray shaded boxes represent the interquartile distance between the upper and lower quartile with the median plotted as a horizontal line within the box. Whiskers in g, h depict the lower quartile − 1.5 × interquartile distance and upper quartile + 1.5 × interquartile distance (only individuals rhythmic both pre- and post-SVE were included in paired t tests due to the requirements of this repeated-measures assessment; n = 25 of 25 WT, 19 of 39 Vipr2−/−, 6 of 17 Vip−/−, 5 of 22 Vip−/−Vipr2−/−). Versions of g, h showing all data points pre- and post-SVE can be seen in Figs. S1g, h. Bar chart/dot shading for f–h is as shown in e. SVE significantly increased the proportion of Vipr2−/−, Vip−/−, and Vip−/−Vipr2−/− mice rhythmic with an ~24 h period (p < 0.00001, p = 0.0195, and p = 0.035, respectively; McNemar’s test). Such mice do not spontaneously generate ~24 h behavioral rhythms in extended DD in the absence of SVE (Fig. S1a, b). The period of post-SVE locomotor behavior was significantly lengthened in Vipr2−/−, Vip−/−, and Vip−/−Vipr2−/− mice (p < 0.00001, p = 0.0028, and p < 0.00001, respectively; paired t tests) and rhythm strength was significantly increased in Vipr2−/− and Vip−/−Vipr2−/− mice (both p < 0.05); paired t tests). The phase angles of entrainment were significantly different between “LD to pre-SVE (DD1)” and “SVE to post-SVE (DD2)” for Vipr2−/− and Vipr2−/−Vip−/− (p < 0.0001) and Vip−/− (p < 0.005) mice, and there was a significantly different phase relationship between these transitions for WT mice (p < 0.0001; all paired t tests; also see Fig. S1e). *p < 0.05; **p < 0.01; ***p < 0.00005; ****p < 0.00001. Also see Fig. S1.

