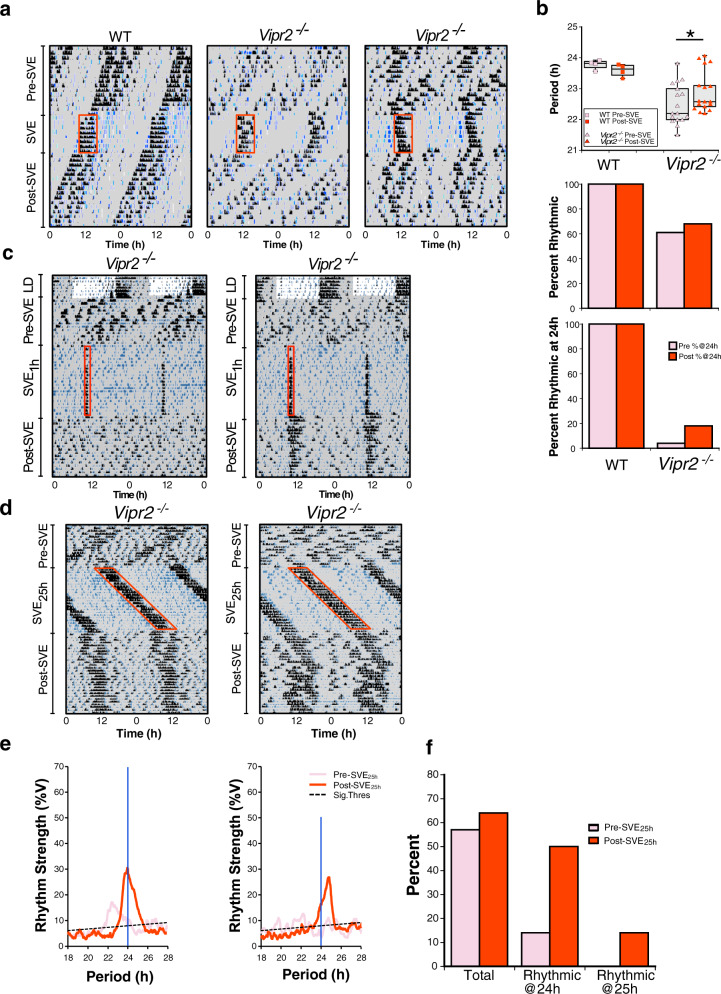
Fig. 2. Neuropeptide signaling-deficient mice show dose-dependent responses to SVE but do not typically express ~25 h rhythms following an SVE Zeitgeber with a 25 h period.
a Representative double-plotted actograms showing locomotor activity (black) and drinking activity (blue) for WT and Vipr2−/− mice (n = 4 and 28, respectively) undergoing an 8-day 24 h SVE protocol. Shaded areas represent darkness. Red boxes indicate time of wheel availability during SVE (6 h). b Dot plot overlaid on box plot depicts the period of wheel-running activity, while bar charts show the percentage of mice rhythmic (in total) and percentage of mice rhythmic with ~24 h period pre- and post-SVE. Gray shaded boxes represent the interquartile distance between the upper and lower quartile with the median plotted as a horizontal line within the box. Whiskers in b depict the lower quartile − 1.5 × interquartile distance and upper quartile + 1.5 × interquartile distance, while the individual data point symbols show only points that contributed to statistical assessment (only individuals rhythmic both pre- and post-SVE were included in paired t tests due to the requirements of this repeated-measures assessment; n = 4 of 4 WT, 17 of 28 Vipr2−/−). A version of this panel showing all data points pre- and post-SVE can be seen in Fig. S2c. Bar/dot shading for upper and middle panels of b is as shown in the lower panel. The increase from 4 to 18% of the Vipr2−/− population (n = 28 total) expressing ~24 h rhythms following 8 days of SVE is not significant. However, the mean period of post-8-day SVE Vipr2−/− mice was significantly lengthened (22.94 ± 0.16 h post-SVE vs. 22.5 ± 0.03 h pre-SVE; p = 0.023; paired t test). *p = 0.023. Post 8-day SVE, WT behavioral period was significantly shorter than pre-8-day SVE, which represents the typical shortening of period associated with continued free run in constant darkness and is not a result of 8-day SVE (see Table 1). c Representative double-plotted actograms showing locomotor activity (black) and drinking activity (blue) for Vipr2−/− mice (n = 8) undergoing a 1 h per day SVE protocol (SVE1h). Shaded areas represent darkness. Red boxes indicate time of wheel availability during SVE (1 h). One individual exhibited robust ~24 h rhythms in behavior after 1 h/day of SVE for 21 days, but the remaining 7 individuals failed to express clearly identifiable rhythms. See also Table 1. d Representative double-plotted actograms showing locomotor activity (black) and drinking activity (blue) for Vipr2−/− mice (n = 14) undergoing a 25 h SVE protocol (SVE25h). Here the animals have the opportunity to voluntarily exercise in the running wheel for 6 h every 25 h. Shaded areas represent darkness. Red boxes indicate time of wheel availability during SVE. e Chi2 periodograms showing dominant circadian period of running-wheel activity both pre-SVE25h (pink/light) and post SVE25h (red/dark). Diagonal broken lines indicate significance threshold at p = 0.0001. Vertical blue lines indicate 24 h period for visual reference. f Bar chart showing percentages of mice rhythmic (in total), rhythmic with ~24 h period, and rhythmic with ~25 h period, pre- and post-SVE25h. Few Vipr2−/− mice express ~25h period behavioral rhythms post-SVE25h, with most mice that are rhythmic expressing ~24 h rhythms in behavior. Also see Table 1.

