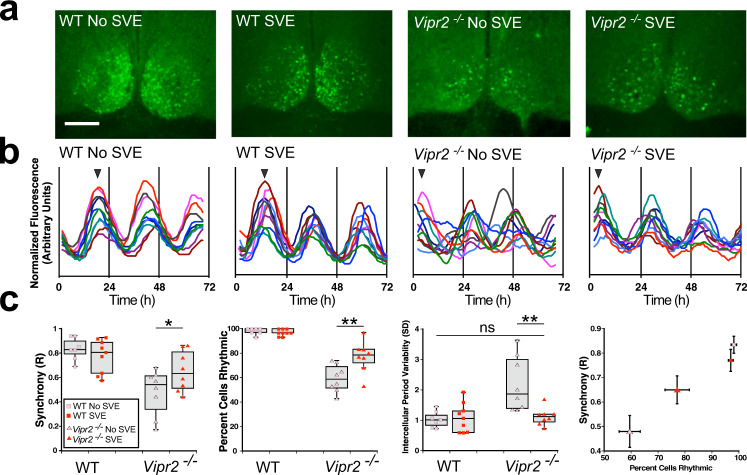
Fig. 3. SVE significantly improves Vipr2−/− SCN temporal architecture.
a Photomicrographs of WT and Vipr2−/− SCN tissue from non-SVE and SVE mice expressing mPer1::d2eGFP fluorescence, resolved to the single-cell level (scale bar: 200 µm). b Example rhythm profiles show 10 cells each from single bilateral SCN recordings of mPer1::d2eGFP fluorescence. Arrowheads in b indicate phase of images shown in a. c SVE significantly increased the synchrony (Rayleigh R increased to 0.65 ± 0.06 from 0.48 ± 0.07 (mean ± SEM); p = 0.039) and rhythmicity (77 ± 5% vs. 59 ± 4%; p = 0.001) and reduced the intercellular variability (SD of intercellular periods reduced to 1.1 ± 0.1 from 2.2 ± 0.3; p = 0.001) of rhythms resolved at the single-cell level in Vipr2−/− SCN-containing brain slices. Correlation plot (c, far right panel) illustrates the relationship between cellular synchrony and percentage of cells rhythmic across SCNs from both genotypes and experimental conditions. *p < 0.05; **p < 0.01. WT non-SVE: 210 cells from 7 slices; WT SVE SCN: 270 cells from 9 slices; non-SVE Vipr2−/− SCN: 190 cells, 8 slices; post-SVE Vipr2:−/− 210 cells, 8 slices. Gray shaded boxes represent the interquartile distance between the upper and lower quartile with the median plotted as a horizontal line within the box. Whiskers in c depict the lower quartile − 1.5 × interquartile distance and upper quartile + 1.5 × interquartile distance. Individual data points overlaid. Also see Fig. S3.

