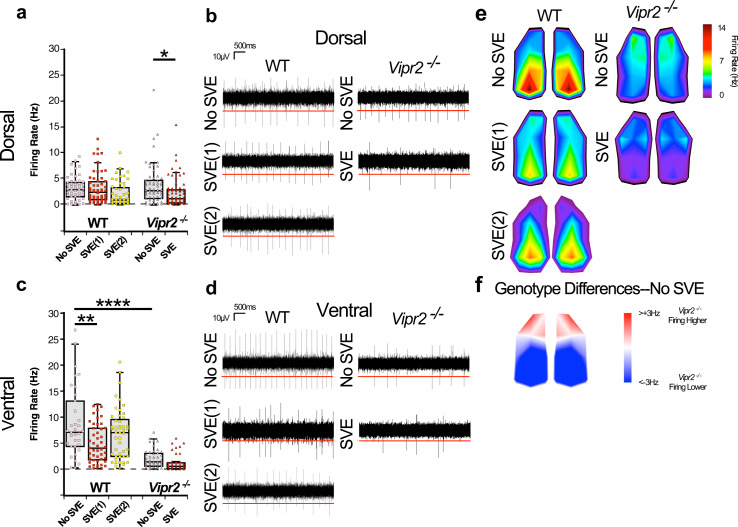
Fig. 4. Altered spontaneous action potential firing in the SCN of WT and neuropeptide signaling-deficient mice and its manipulation by SVE.
Box plots overlaid with dot plots (a, c), example recordings (b, d), and topographical heatmaps (e, f) showing multiunit MEA recordings of spontaneous action potential firing at (~CT13 for non-SVE control mice, 1 h following onset of wheel availability/onset of activity for SVE Vipr2−/− animals, and either 1 h following the onset of wheel availability (SVE(1)) or onset of behavior (drinking; SVE(2)) in WT mice). Also see Fig. S5. In the dorsal SCN subregion, firing rate varied across genotypes and exercise condition (1-way ANOVA; p < 0.0001) (see also Table S1). In the WT SCN, scheduled exercise did not alter action potential frequency in the dorsal subregion (mean ± SEM; 3.1 ± 0.3, 3.2 ± 0.4, and 2.1 ± 0.4 Hz, respectively, for non-SVE, SVE(1), and SVE(2) (n = 48, 54, and 45 recording electrodes); both p > 0.05; a, b; Table S1). Firing rate in the Vipr2−/− dorsal SCN did not differ from WT mice (p > 0.05), but scheduled exercise reduced spontaneous action potential frequency (3.8 ± 0.5 vs. 2.3 ± 0.3 Hz; n = 59 and 67; p = 0.041 a, b). In the ventral subregion, firing rate varied across genotypes and exercise condition (1-way ANOVA; <0.0001). In the WT ventral SCN, action potential frequency was reduced by scheduled exercise in the SVE(1) condition (8.8 ± 1.1 vs. 4.9 ± 0.6 Hz; n = 35 and 47, p = 0.01) but not in the SVE(2) group (6.8 ± 0.7 Hz; n = 48, p > 0.05; c, d). In the Vipr2−/− ventral SCN, spontaneous firing rate was lower than WT (p < 0.0001), but scheduled exercise did not significantly alter firing rate (1.9 ± 0.3 vs. 1.1 ± 0.2 Hz; n = 47 and 45; p > 0.05; c, d). Heatmaps show average firing (e) and differences in firing between non-SVE WT and Vipr2−/− SCN (f). Horizontal red lines in b, d show detection threshold at −17 µV. Gray shaded boxes in a, c represent the interquartile distance between the upper and lower quartile with the median plotted as a horizontal line within the box. Whiskers depict the lower quartile − 1.5 × interquartile distance and upper quartile + 1.5 × interquartile distance. Individual data points are overlaid. Recordings were made from six SCN-containing brain slices from WT non-SVE mice, and seven slices each from WT SVE(1), WT SVE(2), Vipr2−/− non-SVE, and Vipr2−/− SVE mice. *p < 0.05; **p < 0.01; ****p < 0.0001. Also see Fig. S4. Further details of statistical outcomes are in Table S1.

