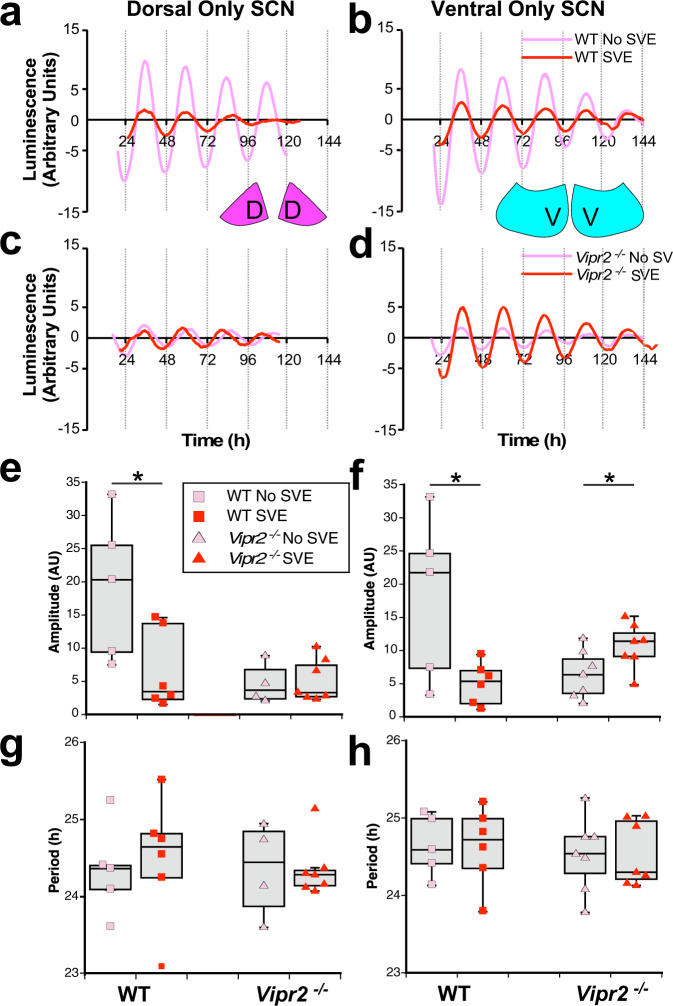
Fig. 6. SVE improves molecular rhythms in the ventral SCN in microdissected explants from Vipr2−/− mice.
a–d PER2::LUC bioluminescence amplitude was significantly reduced by SVE in the WT dorsal only SCN (doSCN; pink filled D diagram insert) and ventral only SCN (voSCN; blue filled diagram insert) microdissected mini slices (dorsal: 19.2 ± 4.8 vs. 6.5 ± 2.4 arbitrary units, p = 0.018; ventral: 18.0 ± 5.6 vs. 5.0 ± 1.3, p = 0.017) but was boosted by SVE in the Vipr2−/− voSCN (6.4 ± 1.4 vs. 10.7 ± 1.3; p = 0.041, all t tests). SVE did not alter amplitude in the Vipr2−/− doSCN (4.6 ± 1.5 vs. 5.1 ± 1.2; p > 0.05). Period (g, h) was not altered by SVE in either part of the SCN for either genotype. Gray shaded boxes in e–h represent the interquartile distance between the upper and lower quartile with the median plotted as a horizontal line within the box. Whiskers depict the lower quartile − 1.5 × interquartile distance and upper quartile + 1.5 × interquartile distance. Individual data points are overlaid. *p = 0.05. Symbol color coding in f–h is as shown in e. a, c, e, g show data from doSCN. b, d, f, h show data from vo SCN. See also Figs. S3 and S4. D and V in diagram inserts label dorsal SCN and ventral SCN, respectively.

