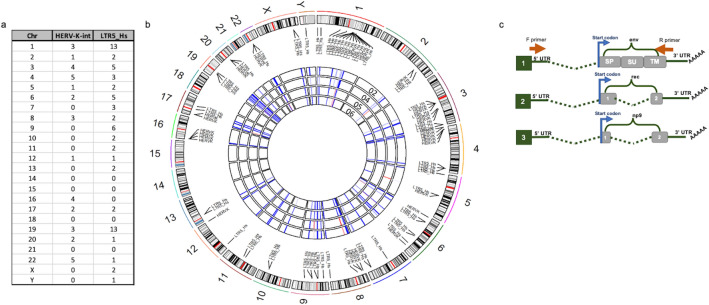
Figure 4.
RNA sequencing of AT/RT cell lines. (a,b) HERV-K (HML-2) internal coding genes and LTR5_Hs are expressed from most chromosomes. (a) Table shows quantity of loci expressed on each chromosome (Chr). (b) Graphical depiction of HERV-K (HML-2) internal coding genes in (HERV-K-int) and LTR5_Hs in (long terminal repeat 5 human specific) expression in four AT/RT cell lines. The outer ring is comprised of the chromosomes from the human genome with the list of both “HERV-K-int” (internal coding sequence) and LTR5_Hs loci and black lines connecting them to their approximate location on the chromosome. The four rings in the center correspond to the CHLA 02, 04, 05, and 06 cell lines with the 02 cells being the outermost circle and the 06 cells the innermost circle. The segments of the central circles represent the chromosomes; blue and red lines correspond to the level of expression of either the LTR5_Hs or HERV-K (HML-2) labeled at that location (red denotes higher expression, blue denotes less). (c) Scheme for PCR amplification and Sanger sequencing validation of HML-2 transcripts. Shows a representation of primer position relative to potential env, rec, and np9 transcripts which are transcribed in the AT/RT cells. The forward primer used for amplifying env (1), rec (2), and np 9 (3) transcripts is positioned in the 5’ UTR while the reverse primer is positioned in the 3’ UTR. Because both primers are in the UTRs, env, rec and np9 transcripts can all be amplified with the same primer set. The image in (b) was generated with the RCircos package version 1.2.1 (https://bmcbioinformatics.biomedcentral.com/articles/10.1186/1471-2105-14-244).

