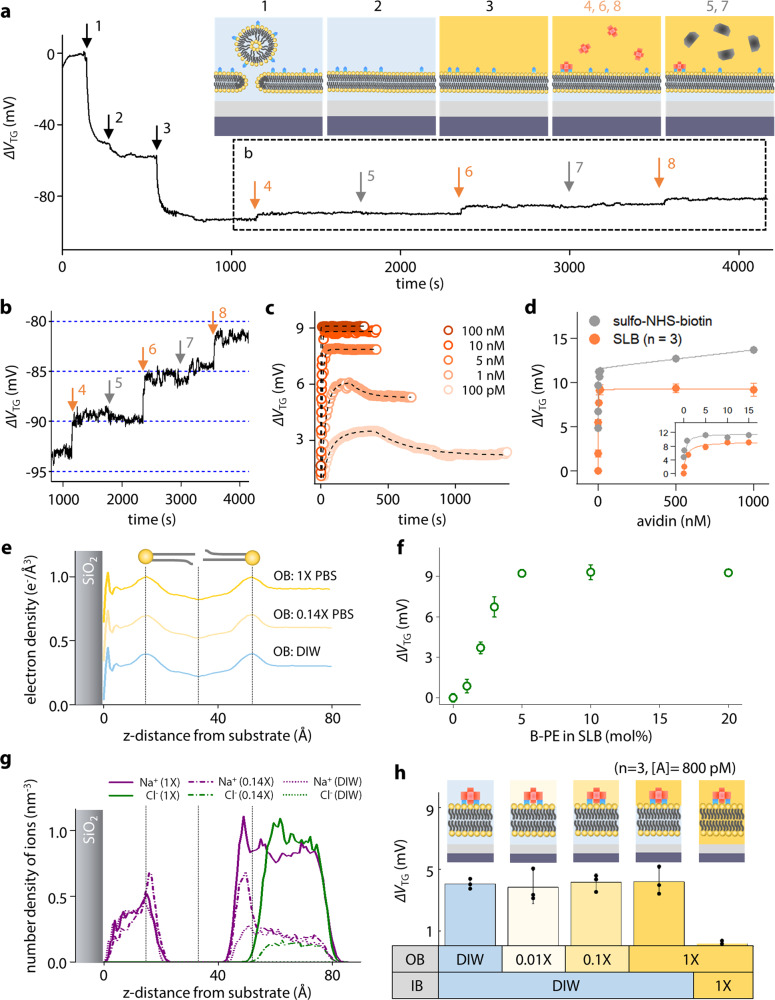
Fig. 3. Measurements of biotin–avidin bindings using SLB-FET.
a Real-time measurement for SLB formation and sequential molecular bindings. The inset illustrates different measurement stages. b Enlarged graph in a showing binding selectivity to avidin. c Real-time traces (circle) from biotin–avidin binding at different concentrations. Dashed lines represent fits by an analytical model. d Response amplitudes as a function of avidin concentration in the presence (orange)/absence (gray) of the SLB. The reported values of the SLB experiment represent the mean ± standard deviation (SD) for n = 3 independent experiments. e Electron density profile of supported lipid bilayer with different OB ionic concentrations obtained from the MD simulation. f ΔVTG at different concentrations of B-PE expression in the SLB with the constant number of avidin binders. The reported values of the SLB experiment represent the mean ± standard deviation (SD) for n = 3 independent experiments. g MD simulation results of ion distribution of (Na+ and Cl−) at different concentrations. Note that significant Na+ peaks at z = 10 and 50 Å results from the lipid head group of the B-PE. h Sensor responses to 800 pM-avidin under different ionic conditions around the SLB. The measurement was performed for n = 3 independent experiments and all reported values represent the mean ± SD. Source data are provided as a Source Data file.

