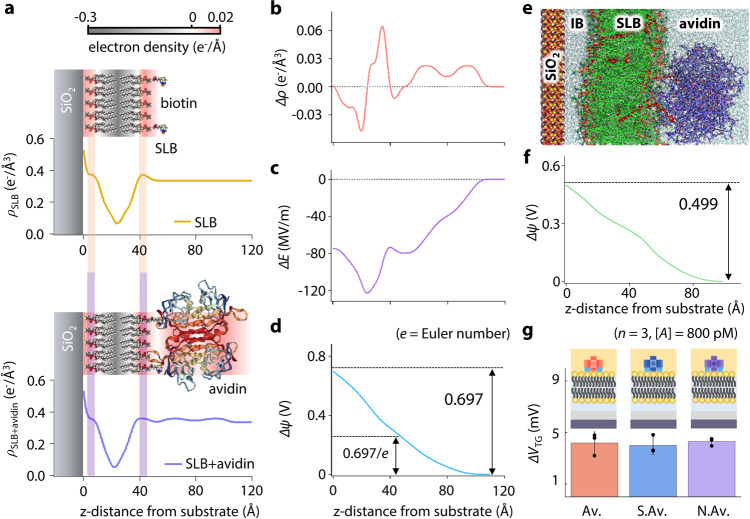
Fig. 4. Redistribution of the electron density in the SLB upon biotin–avidin bindings.
a Electron density profiles before and after biotin–avidin bindings. b Electron density difference (Δρ = ρSLB + avidin − ρSLB). c Electric field change. d Chemical potential difference upon biotin–avidin binding. e MD simulation of the SLB under avidin binding. The DOPC lipids, B-PE lipids, avidin, and water molecules are colored in green, red, purple, and cyan, respectively. f Induced potential difference upon biotin–avidin binding obtained from MD simulation (see Supplementary Note 11 for details). g Sensor responses to different analytes at identical concentrations. (Av. avidin, S.Av. streptavidin, and N.Av. neutrAvidin). The measurement values represent the mean ± SD for n = 3 independent experiments. Source data are provided as a Source Data file.

