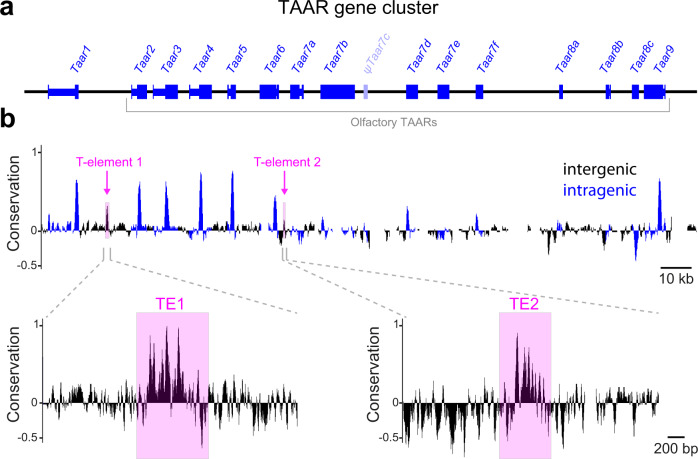
Fig. 2. Identification of putative enhancers in the TAAR cluster.
a Gene structure of all 15 intact TAARs (blue) and the pseudogene ψTaar7c (light blue). Exons (thick lines) and introns (thin lines) are indicated. b Basewise conservation across eutherian mammals in the TAAR cluster determined using PhyloP. Regions within known genes are shown in blue, intergenic regions in black. Two intergenic regions that have high conservation peaks and HD sequences (TE1 and TE2) are highlighted (magenta). Conservation track is expanded below.

