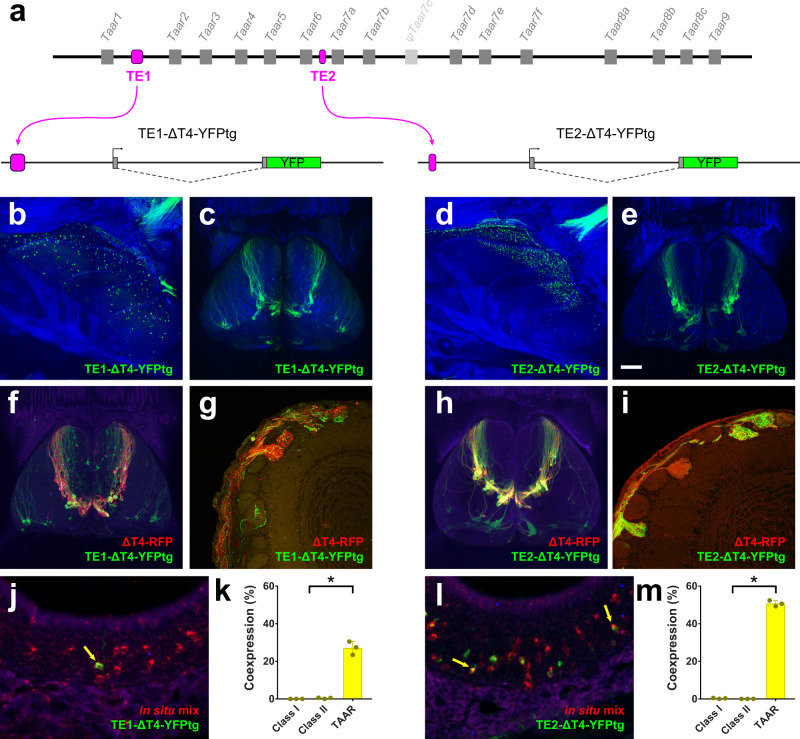
Fig. 5. TE1 and TE2 drive expression of the TAAR4 transgene.
a Top, schematic of TAAR cluster showing placement of TE1 or TE2 (magenta). Bottom, diagram of ΔT4-YFP transgenes in which TE1 and TE2 are inserted upstream of the Taar4 promoter and YFP coding sequence (green). b–e Wholemount confocal images of olfactory epithelium and olfactory bulb of TE1-ΔT4-YFPtg and TE2-ΔT4-YFPtg mice showing YFP expression in OSNs in the epithelium and labeled axons and glomeruli in the dorsal olfactory bulb. OSN axons project to a cluster of dorsal glomeruli, reminiscent of the endogenous TAAR glomeruli. f Confocal image of dorsal olfactory bulbs, and g histological section, of a mouse that has the TE1-ΔT4-YFPtg and a ΔT4-RFP targeted allele. RFP+ and YFP+ axons target the same glomeruli. h Confocal image of dorsal olfactory bulbs, and i histological section, of a mouse that has the TE2-ΔT4-YFPtg and a ΔT4-RFP targeted allele. RFP+ and YFP+ axons target the same glomeruli. j, l Combined in situ hybridization (TAAR probe mix, red) and immunohistochemistry for YFP (green) in histological sections of olfactory epithelium from TE1-ΔT4-YFPtg (j) and TE2-ΔT4-YFPtg (l) mice. Co-expressing cells indicated by yellow arrows. k, m Fraction of YFP+ cells that label with the class I, class II, or TAAR probe pools in TE1-ΔT4-YFPtg (k) and TE2-ΔT4-YFPtg (m) animals (n = 3 mice). Error bars indicate mean ± SEM. *p < 0.0001; two-sided, one-way ANOVA, Dunn–Šidák correction for multiple comparisons. Scale bar in e = 500 µm in b, c, d, e, f, and h; 100 µm in g and i; 25 µm in j and l.

