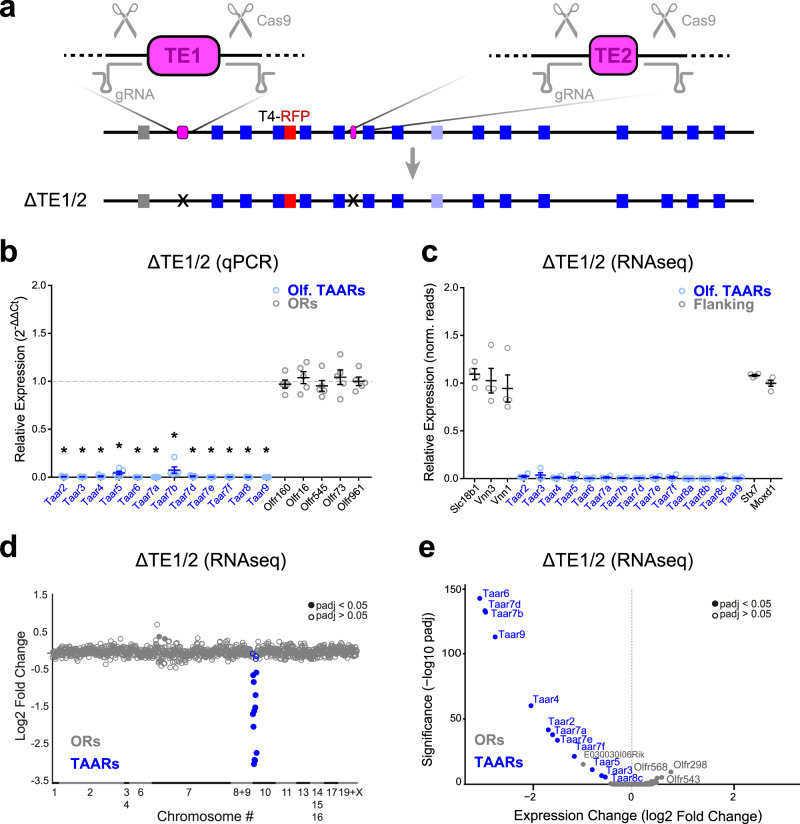
Fig. 6. TE1 and TE2 are required for TAAR gene expression.
CRISPR-based gene editing was used to generate a double, cis deletion of both TE1 and TE2. a Diagram showing locations of gRNAs (gray) designed to target PAM sites flanking TE1 and TE2 (magenta). The double deletion (ΔTE1/2) was generated on a chromosome harboring a previously targeted Taar4-RFP allele (red). Bottom, diagram of ΔTE1/2 in cis with Taar4-RFP. Deletion is marked (X). b Relative fold expression of TAAR (blue) and control OR (gray) genes measured using qPCR (2-ΔΔCt method) from olfactory mucosa. Error bars indicate mean ± SEM. Taar8 primers amplify all 3 family members. n = 5 mice per genotype. *p < 0.0001; two-sided, one-way ANOVA, Dunn–Šidák correction for multiple comparisons. c Relative expression (Δ/wtavg normalized counts from DESeq2) for olfactory TAAR genes (blue) and genes flanking the TAAR cluster (gray). Error bars indicate mean ± SEM. n = 4 mice per genotype. d Change in expression (log2 fold change) of all ORs (gray) and TAARs (blue) measured via RNAseq (n = 4 mice for each genotype). e Volcano plot (−log10 adjusted p value vs. log2 fold change) from DESeq2 analysis of RNAseq data from homozygous ΔTE1/2 and wild-type littermate control olfactory mucosa showing that TAAR genes are selectively affected by deletion. All genes with normalized counts >10 are plotted. Filled circles indicate genes with adjusted p values <0.05 two-sided (DESeq2) Wald test corrected for multiple comparisons (Benjamini and Hochberg). p-values for RNAseq data can be found in Source Data File.

