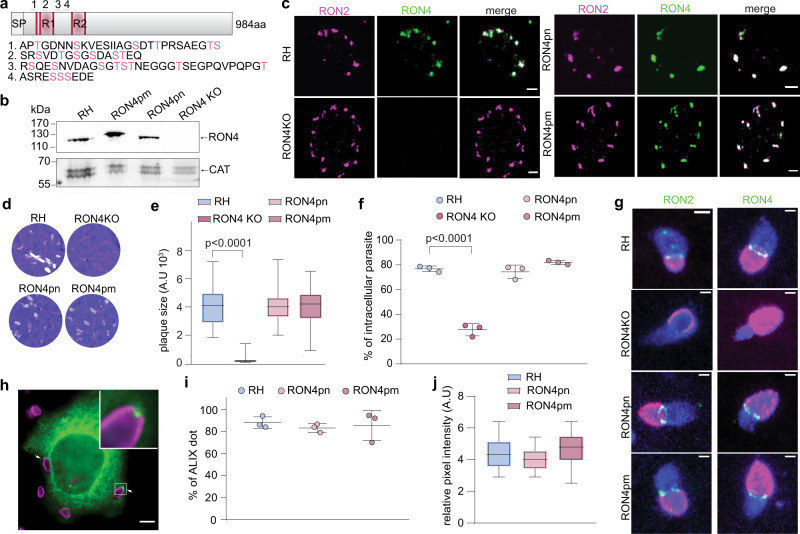
Fig. 9. Phosphorylation of RON4 is not required for MJ formation and ALIX recruitment.
a Schematic representation of RON4 protein. Two repeats (R1 and R2) and five motifs (pink lines) known to be important for binding host cytoskeleton are present in the N-term of RON4. The number (1, 2, 3, and 4) indicate the regions of RON4 known to be phosphorylated. The corresponding amino acid sequences and phosphorylated residues are indicated below in pink. These amino acids have been mutated in alanine or negatively charged amino acid to generate RON4 phosphonull (ron4pn) and RON4 phosphomimetic (ron4pm) mutant parasites, respectively. b Western blot showing that RON4pn and RON4pm are properly expressed. RON4-KO parasites have undetectable amount of RON4. Image representative of three biologically independent experiments. c IFA showing that mutation of phosphorylated residues either in Ala (ron4pn) or in Asp (ron4pm) does not impact RON4 (green) targeting to the rhoptry neck. Scale bar = 2 µm. Image representative of three biologically independent experiments. RON2 (magenta). d Plaque assay comparing the ability parasites to accomplish the lytic cycle. Image representative of three independent experiments. e Quantification of the plaque assay experiment. Data are presented as box and whiskers plot (median with min to max, n = 3 biologically independent experiments). Statistical significance was assessed by a one-way ANOVA significance with Tukey’s multiple comparison. f Invasion test showing the percentage of intracellular parasites reflecting their ability to invade. One-way ANOVA followed by Tukey’s multiple comparison was used to test differences between groups. (Mean ± SD; n = 3 biologically independent experiments). g IFA of invading parasites with RON2 (green) and RON4 (green) seen at the MJ except for RON4-KO invading parasites. SAG1 (magenta) and GAP45 (blue) were used to discriminate invading parasites. Scale bar = 1 µm. Image representative of three biologically independent experiments. h ALIX-GFP (green) expressing HeLa cells infected by RH parasites (magenta). ALIX recruitment at the MJ closure is indicated by white arrowhead. The inset displays the white boxed area at higher magnification. Scale bar = 5 µm. Image representative of three biologically independent experiments. i Quantification of the proportion of intracellular parasites associated with an ALIX dot in an in/out assay. Data are presented as box and whiskers plot (median with min to max, n = 3 biologically independent experiments). Statistical significance was assessed by a one-way ANOVA significance with Tukey’s multiple comparison. j Relative pixel intensity of ALIX dot recruited at the MJ in infected ALIX-GFP HeLa cells. When not stated two-way ANOVA followed by Tukey’s multiple comparison was used to test differences between groups. (Mean ± SD; n = 3 biologically independent experiments). Source data are provided as a Source data file.

