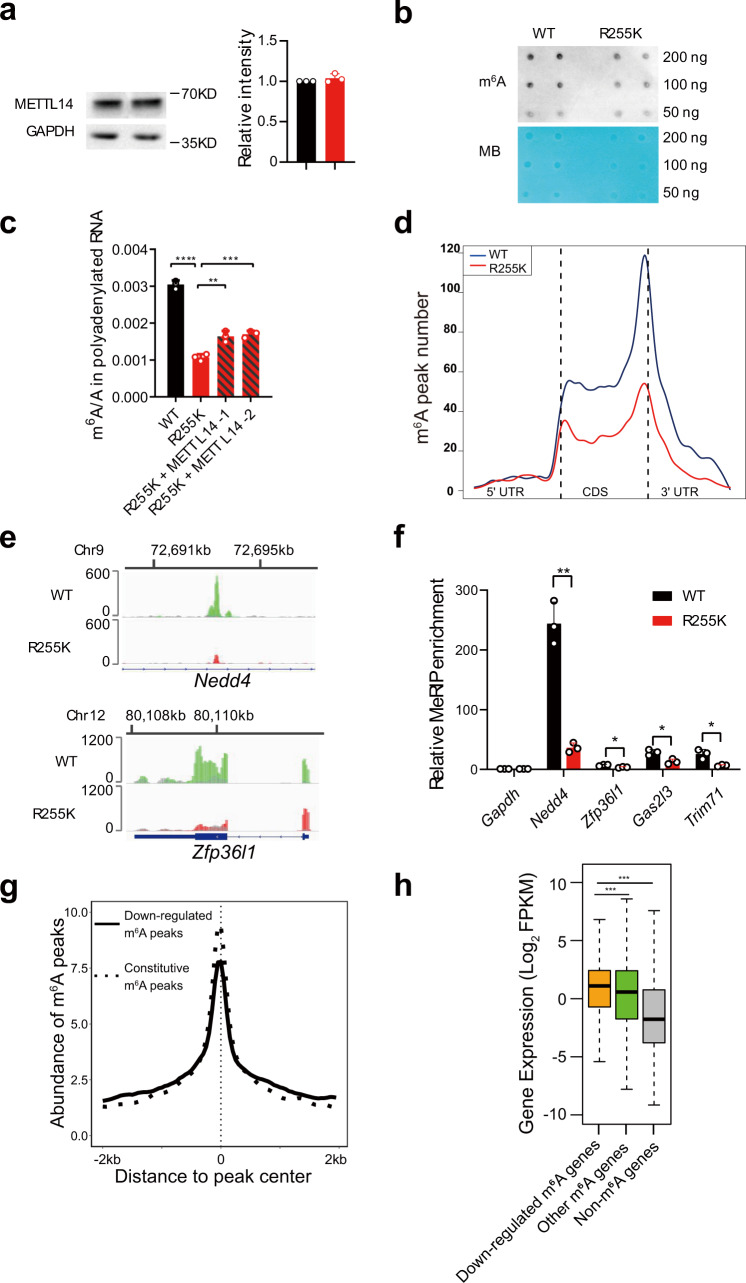
Fig. 2. METTL14 R255K decreases mRNA m6A modification.
a Western blot showing the protein level of METTL14 in WT and METTL14 R255K knock-in mESCs. Representative figures of three blots are shown. The band intensity of METTL14 relative to GAPDH is shown in the right-hand panel, and data are mean ± s.d. from three independent replicates. b Dot blot showing the m6A mRNA modification levels from WT and METTL14 R255K mESCs. Methylene blue (MB) was used as a loading control. The experiment was performed once. c LC–MS/MS quantification of m6A abundance in mRNA from WT, R255K, or R255K with METTL14 overexpressed cells. Data are mean ± s.d. of three independent experiments. Two-sided Student’s t test. d Distribution of m6A peaks from WT and METTL14 R255K cells in transcriptomic regions. e Profile of m6A distribution on Nedd4 and Zfp36l1 in WT and R255K cell lines. Shown is normalized density of IP (green or red) versus input (gray). Values on the left show the range of IP and input density. f MeRIP-qPCR verifying decreased m6A peaks on Nedd4, Zfp36l1, Gas2l3, and Trim71. Enrichment of MeRIP versus input RNA was normalized against Gapdh. Data are mean ± s.d. from three independent experiments. Two-sided Student’s t test. g Abundance of m6A signals around the m6A peak center. Solid line, downregulated m6A peaks in R255K. Dotted line, constitutive m6A peaks. h Box plot showing the expression levels of genes with decreased m6A abundance in R255K cells, other m6A modified genes, and non-m6A modified genes. The center line indicates median value, and the box and whiskers represent the interquartile range (IQR) and 1.5 IQR, respectively. Two-sided Mann–Whitney U test. Source data for (a), (c), (f), and (h) are provided as a Source Data file.

