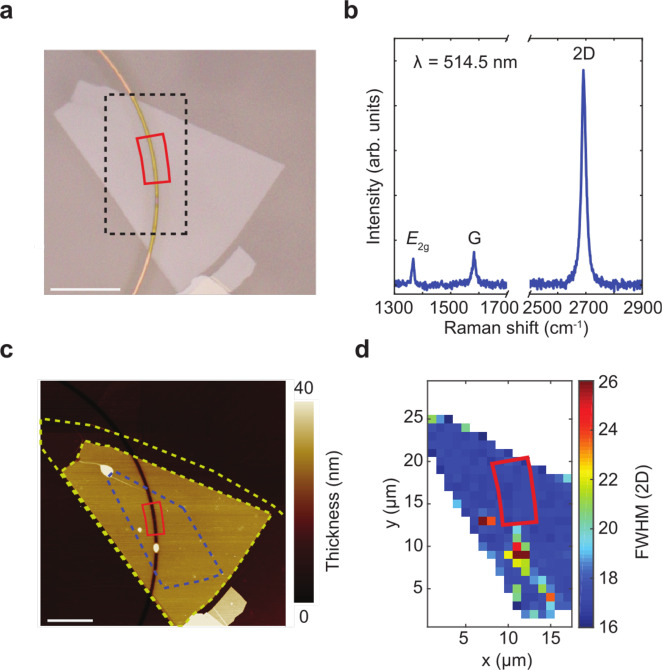
Fig. 3. LMH characterisation.
a Microscope image of hBN/SLG/hBN on ring resonator. The black dashed line indicates the area over which the Raman map in d is measured. Scale bar, 10 μm. b Raman spectrum measured at the position of the final device. c AFM image of LMH. The yellow dashed line indicates the area of top and bottom hBN. The blue line indicates the SLG area. Scale bar, 10 μm. d Raman map of FWHM(2D). The red box marks the position of the final device in a, c, d.

