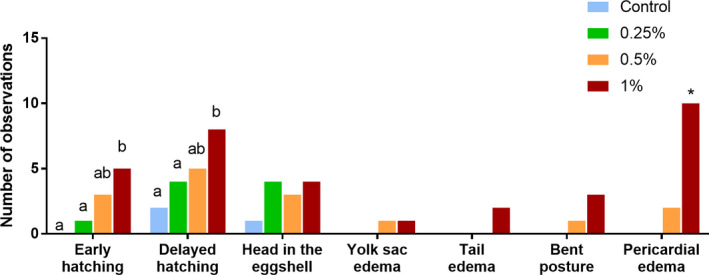
FIGURE 2.

Number of phenotypic abnormalities episodes observed during 120 hr of zebrafish development, for all ethanol treatments + control. Early hatching was considered before 40 hpf, and delayed hatching was considered after 72 hpf (see supplementary material for images of morphological abnormalities). Values are mean ± SEM. (*) and different letters indicate statistical significance among groups, p < .05, two‐way ANOVA followed by Fisher's LSD test, n = 60/group
