
FIGURE 5.
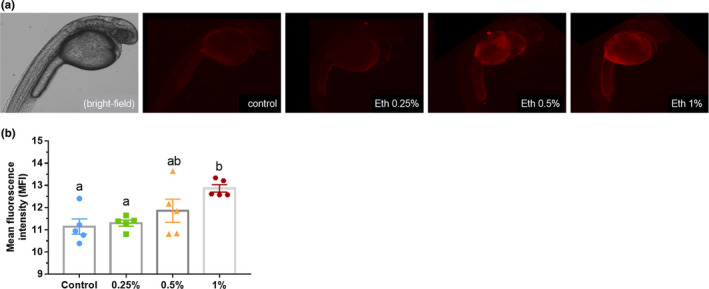
(a) Evaluation of apoptosis in zebrafish larvae exposed to Eth 0.25%, Eth 0.5%, Eth 1%, and control group, and treated with acridine orange solution. A bright‐field image of a 24 hpf embryo is shown for comparison. Note the increase in fluorescence in Eth 0.5%‐ and Eth 1%‐treated animals compared with the control. (b) Graphical representation of mean + SEM of mean fluorescence intensity, calculated by ImageJ. Different letters represent statistical significance between groups, p < .05, Kruskal–Wallis followed by Dunn's test, n = 5/group. Scale bar: 1 µm