
FIGURE 3.
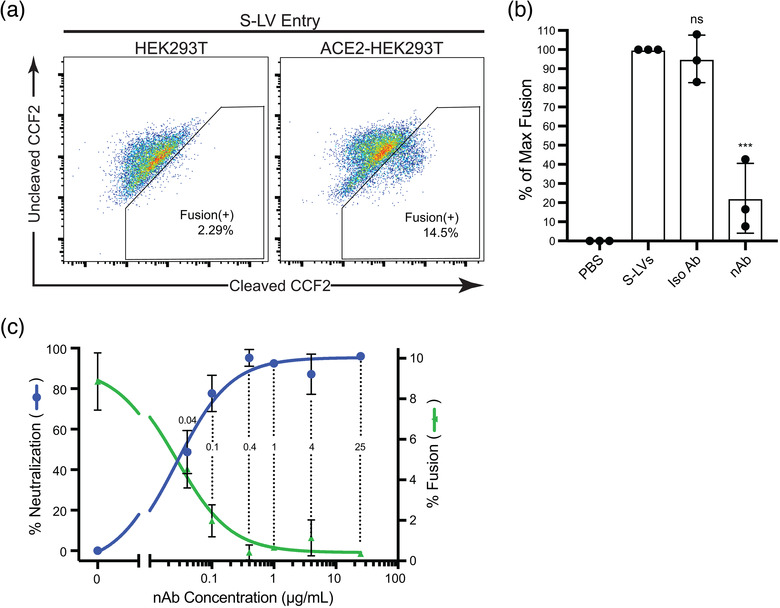
S‐LV entry and neutralization in ACE2‐HEK293Ts. (a) Representative flow cytometry plots of S‐LV entry into HEK293T cells demonstrating dependence on ACE2 expression. The left panel shows S‐LV entry into untransfected HEK293Ts, with a small amount of background dye conversion (also appearing in the uninfected control) appearing in the fusion+ gate. The right panel shows S‐LV entry into HEK293Ts transiently transfected with human ACE2. The Y‐axis represents the uncleaved CCF2 dye signal, while the X‐axis represents CCF2 that has been cleaved by β‐lactamase. (b) S‐LV entry assay in the presence of 25 μg/ml anti‐spike nAb or isotype control antibody. Entry in the absence of nAb was normalized to 100%. Significance was measured by one‐way ANOVA followed by Dunnett's multiple comparisons test. Data are displayed as mean + SD of three independent biological experiments (n = 3) and each point within a column is the mean of three technical replicates. ***, P ≤ 0.001. (c) S‐LV fusion at differing nAb concentrations and neutralization dose curve. The right Y‐axis represents S‐LV entry into ACE2‐HEK293Ts with the background subtracted; the left Y‐axis presents percent neutralization of S‐LV entry, which is calculated from the fusion data as described in the methods. Data are displayed as mean + SD of three technical replicates. Numbers within dotted lines refer to nAb concentrations tested