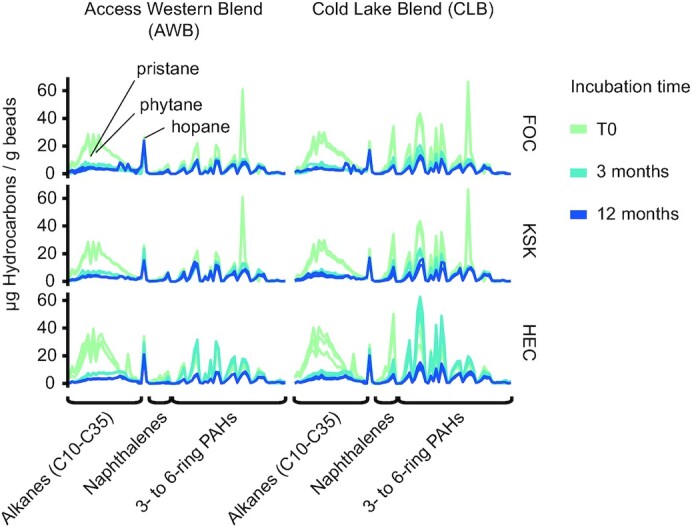
Figure 2.

Changes of dilbit composition over time. Quantity of resolved hydrocarbon compounds normalized to the weight of extracted beads. Each line represents a single sample. The T0 samples of stations FOC and KSK are identical, and the corresponding data are hence duplicated between the panels of both stations. Incubation times of beads are color-coded. Abbreviations: PAHs—polycyclic aromatic hydrocarbons.
