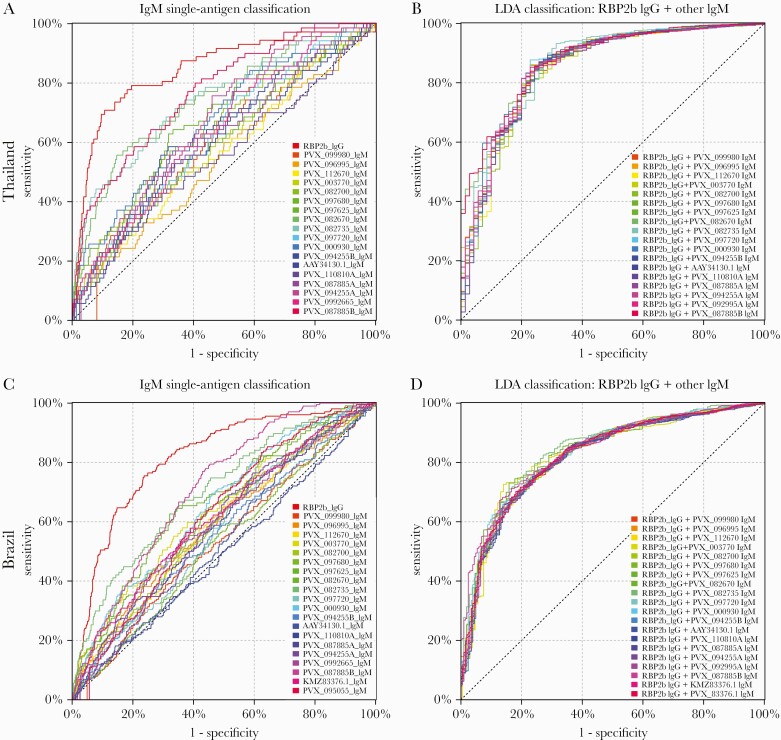
Figure 1.
Performance of IgM antibodies against 18–20 P. vivax proteins individually (A and C) and in combination with the top-performing protein using IgG (B and D) for classification of P. vivax infections in the prior 9 months. In the Thai cohort, IgM antibody responses were measured against 18 P. vivax proteins. A, Classification accuracy of these 18 proteins individually, including the top-performing protein for IgG (RBP2b) as reference in red. B, Results from an LDA combining RBP2b IgG with each of the IgM responses to the 18 proteins. In the Brazilian cohort, IgM antibody responses were measured against 20 P. vivax proteins. C, Classification accuracy of these 20 proteins individually, including the top-performing protein for IgG (RBP2b) as reference in red. D, Results from an LDA combining RBP2b IgG with each of the IgM responses to the 20 proteins. AUC values are shown in Table 1. Abbreviations: AUC, area under the curve; IgG, immunoglobulin G; IgM, immunoglobulin M; LDA, linear discriminant analysis.

