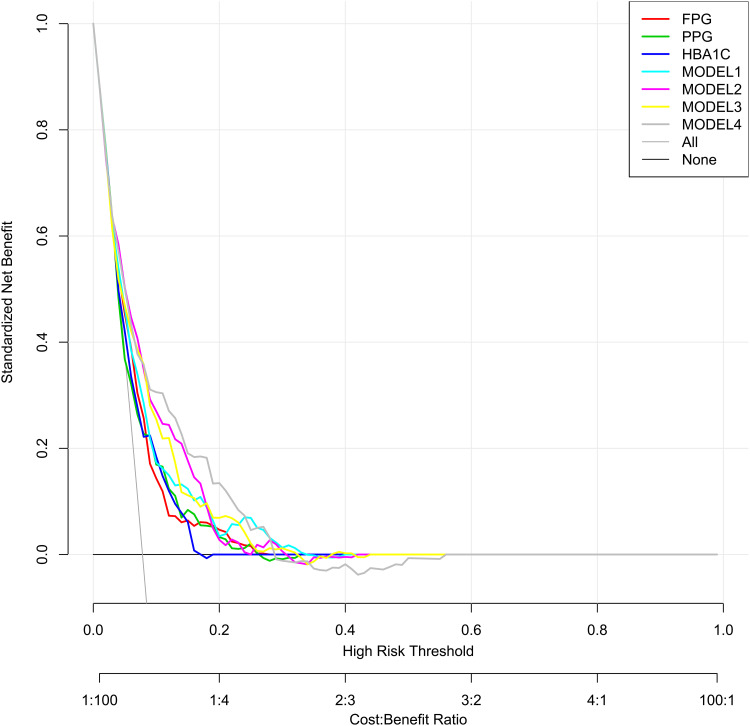
Figure 2.
The DCA of the seven predictive models for diabetes at a 3-years follow-up.
Notes: Net benefit curves of seven predictive models. “None” line=net benefit when no participant is considered as having the outcome (progression to diabetes); “All” line=net benefit when all participants are considered as having the outcome. The preferred model is the model with the highest net benefit at any given threshold.
Abbreviation: FPG, fasting plasma glucose; PPG (2-hr), postprandial plasma glucose; HbA1c, hemoglobin A1c.

