
Fig. 4.
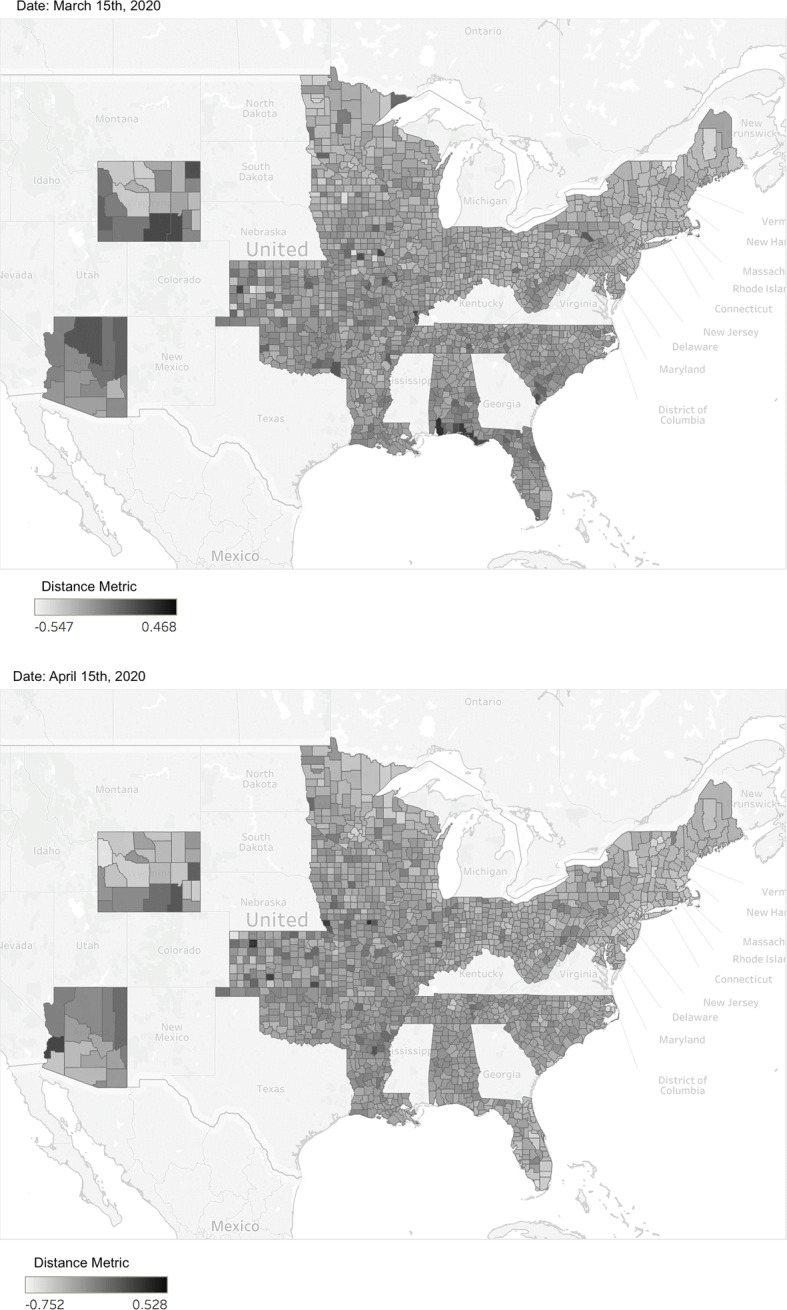
Percentage change in average distance traveled on March 15th and April 15th, respectively. Source: Unacast’s COVID-19 Toolkit. Note the differential coverage by state of travel distance compared to visitation, which affects the sample size in the different specifications depending on the outcome variable