
Figure 2.
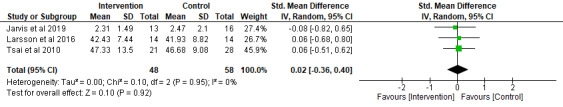
Forest plot of standardized mean differences for loneliness at the 3-month follow-up (digital technology intervention vs control).
Official websites use .gov
A
.gov website belongs to an official
government organization in the United States.
Secure .gov websites use HTTPS
A lock (
) or https:// means you've safely
connected to the .gov website. Share sensitive
information only on official, secure websites.
Forest plot of standardized mean differences for loneliness at the 3-month follow-up (digital technology intervention vs control).