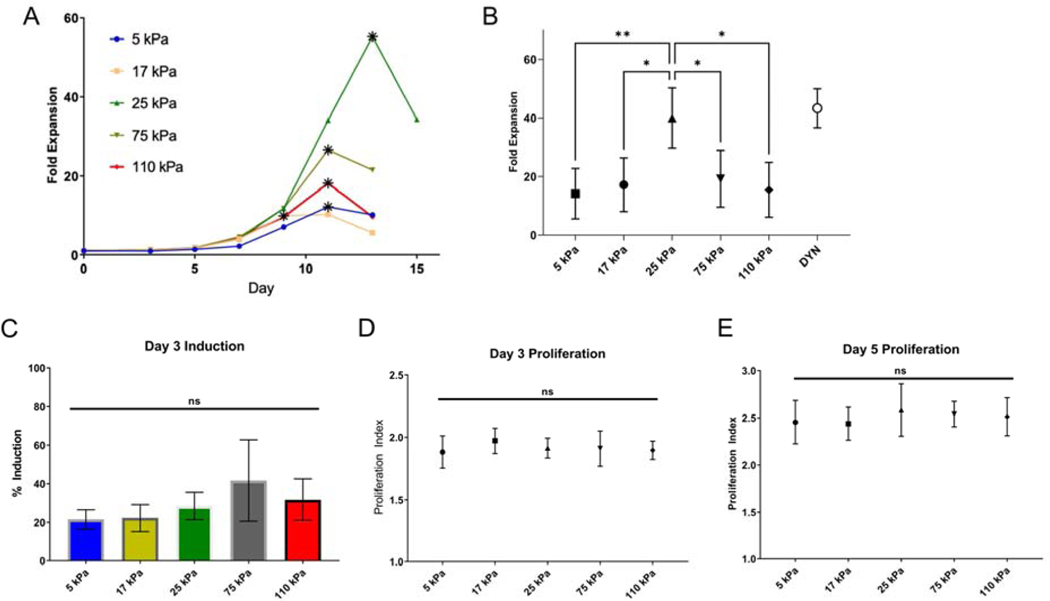
Figure 2. T cell expansion shows biphasic response to substrate stiffness.
(A) Long term proliferation of T cells activated on coated hydrogels. The data in this panel are from a representative experiment, comparing expansion of cells from a single donor as a function of substrate stiffness. For each substrate, the data point corresponding to maximum fold expansion is indicated with an asterisk (*). (B) Maximum fold expansion of T cells activated on hydrogels. Data are mean ± s.d., n= 3 – 8 across at least 3 independent experiments for each condition, *p<0.05, **p<0.01, One-way ANOVA, Tukey multiple comparison test. (C) T cell induction, measured as the percentage of cells that exhibit at least one cell division by 3 days of seeding. Percentage of starting cell population induced to divide 3 days post seeding. Proliferation, defined as average number of divisions per dividing cell, of activated T cells, 3 days (D) and 5 days (E) post seeding, as measured by CFSE dilution. Data are mean ± s.d., n=5 across 3 independent experiments, One-way ANOVA (α = 0.05).

