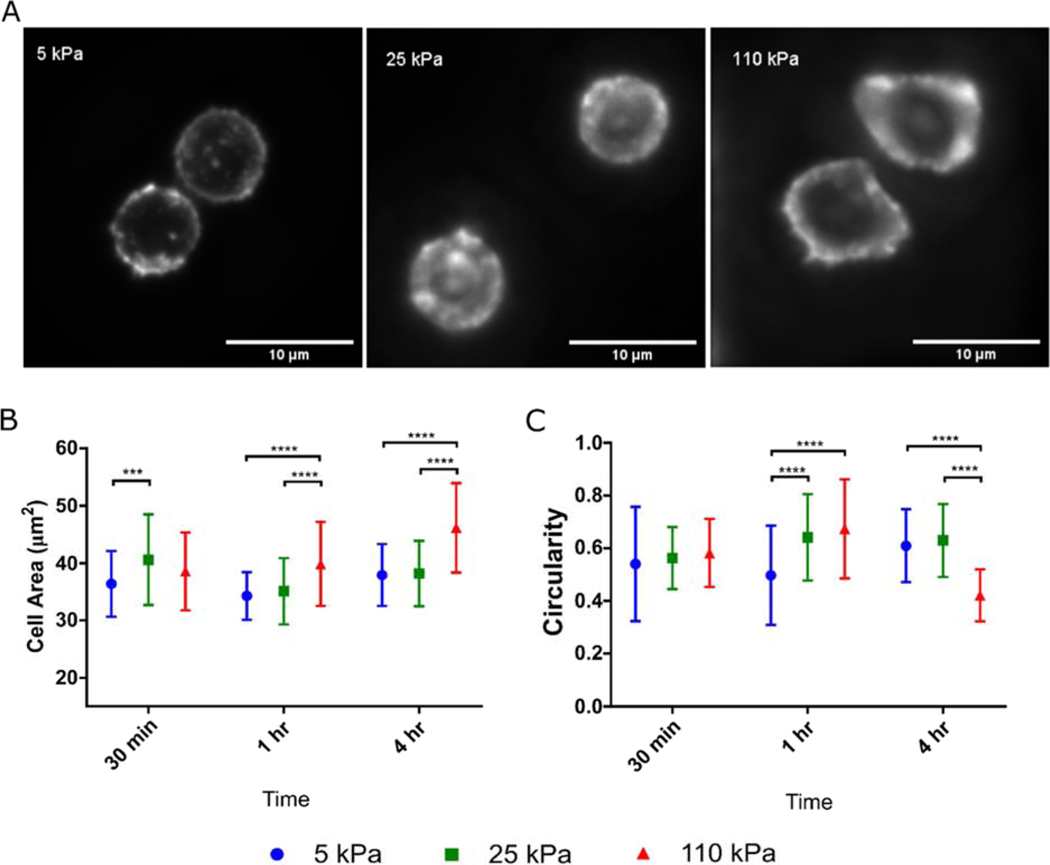
Figure 4. T cell spreading is a function of substrate stiffness.
(A) T cell morphology was assayed by staining for actin. This image illustrates cells on hydrogels 1 hr after seeding. (B) Spreading area and (C) circularity of T cells on hydrogels at 30 minutes, 1 hour, and 4 hour timepoints post seeding, characterized by membrane stain. Data pooled from at least 40 cells across 6 independent substrates for each condition. Data are mean ± s.d., *p<0.05, **p<0.01, ***p<0.001, ****p<0.0001, 2-way ANOVA, Tukey multiple comparison test.

