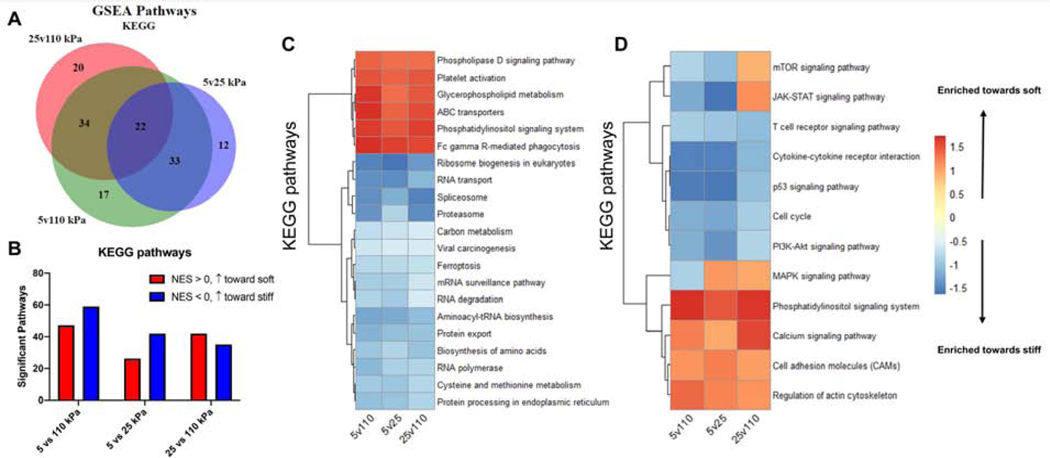
Figure 6. Monotonic enrichment of activation pathways.
(A) Number of Differentially Expressed (DE) genes between for pairwise comparisons. (B) Number of significantly enriched pathways (FDR < 0.1) from KEGG gene sets with for each pairwise comparison (NES > 0 is enrichment towards lower stiffness, NES < 0 is enrichment towards higher stiffness). (C) Normalized enrichment score (NES) of KEGG pathways shared by pairwise comparisons (FDR < 0.1 in 5vs110 kPa comparison). (D) NES of T cell activation related pathways shared by pairwise comparisons. (Top 50 pathways, ranked by FDR)

