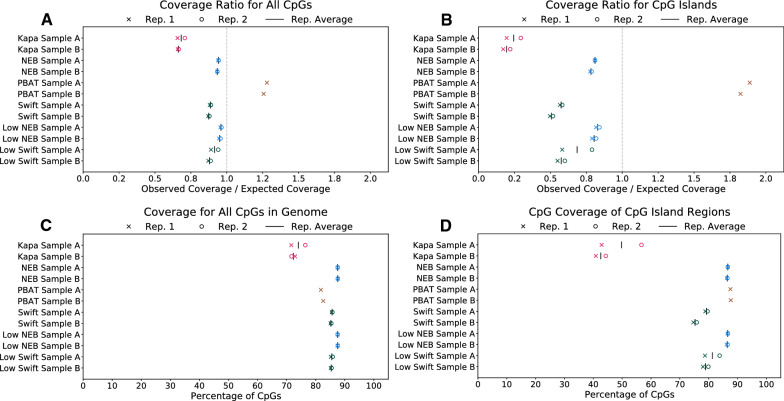
Fig. 3.
Library uniformity as measured by coverage of various genomic element categories. Ratio of observed coverage to expected coverage for A all CpGs and B CpG islands. C Percentage of all CpGs covered by at least one unique read with MAPQ . D Percentage of CpGs in CpG islands covered by at least one unique read with MAPQ . Note, for C and D, all libraries were downsampled to be comparable to PBAT (150 million reads, or 4.8X coverage, per sample, see "Methods" for details); therefore, any differences are not likely confounded by sequencing depth. As expected, this coverage will be substantially higher at increased depth

