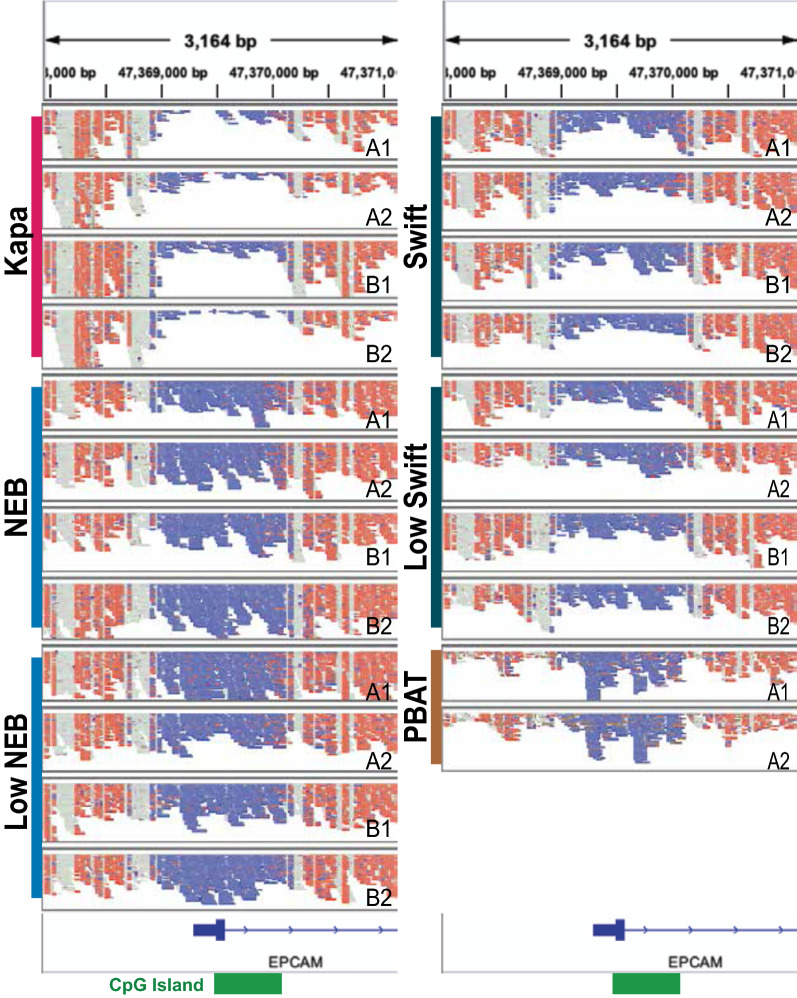
Fig. 4.
The EPCAM promoter region as a representative example for data generated with the protocols. The aligned reads tracks are taken from the Integrated Genomics Viewer (IGV) [45] in the bisulfite mode where red represents an unconverted cytosine and blue represents a converted cytosine. Each panel represents one sample, with A and B denoting the biological replicates and 1 and 2 the technical replicates for each library construction protocol. The shown region is 1500 bp upstream and downstream of exon 1. The location of a CpG island is indicated with a green box on the bottom. Note, the strands for the PBAT samples have been flipped in silico before being displayed to account for the strand definition in the Miura and Ito protocol. The strands in the PBAT protocol are opposite from what is expected by IGV, as well as the definition used by the other protocols. All libraries were downsampled to be comparable to PBAT; therefore, any differences are not likely confounded by sequencing depth. As expected, this coverage will be substantially higher at increased depth

