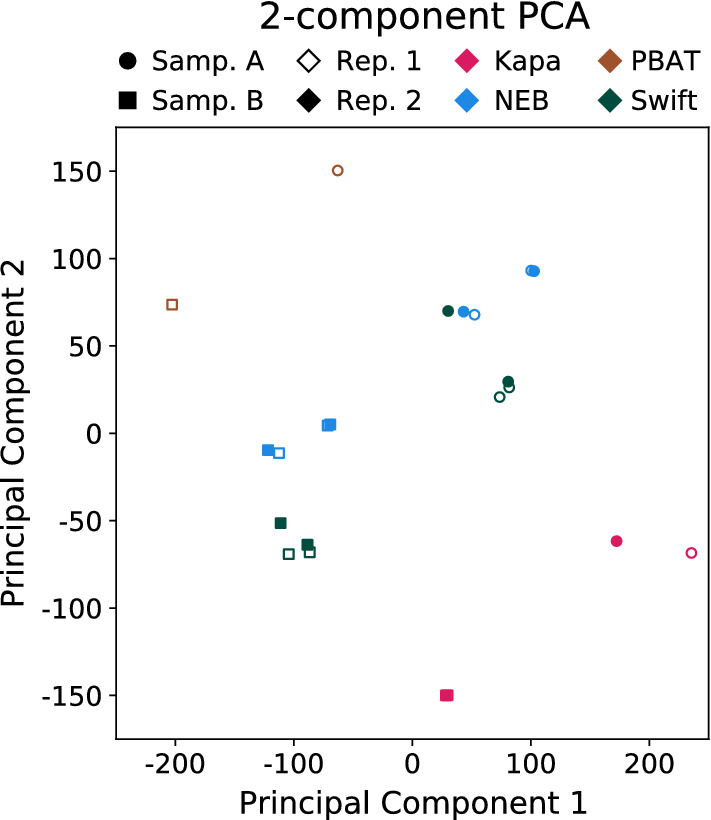
Fig. 8.

Principal components of average methylation levels in 100 kb bins. Principal component 1 accounts for 41.4% of the variance and principal component 2 accounts for 21.6%. The four protocols are presented with different colors. Biological replicates are displayed with shapes, while technical replicates are shown with different empty or filled markers. With regards to the two Kapa Sample B technical replicates, these points sit almost on top of one another, making them hard to distinguish at the scale shown. Note, all libraries were downsampled to be comparable to PBAT
