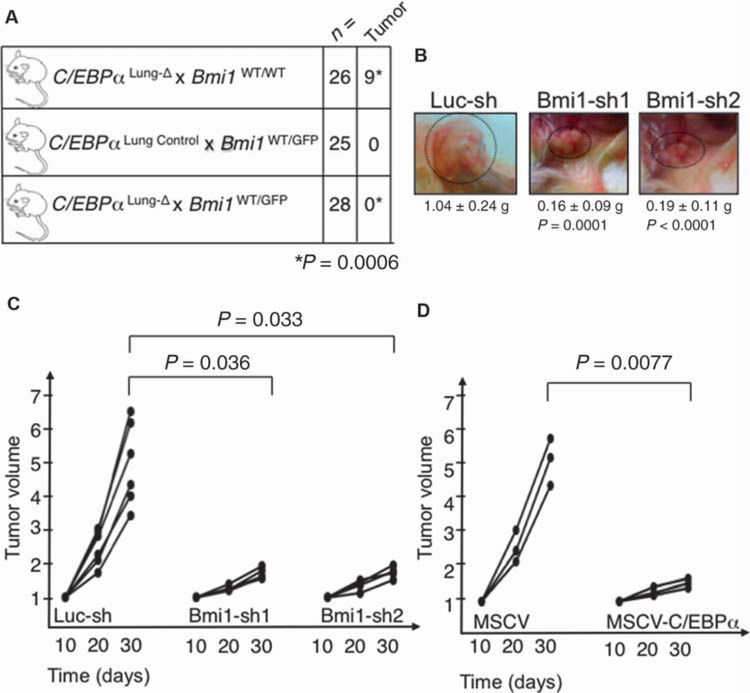
Fig. 4. BMI1 is required for lung tumor formation in C/EBPαLung-Δ mice.
(A) Detection of tumorigenic foci in lungs of mice with reduced Bmi1 expression. Pups were treated with doxycycline, and the presence of tumors was scored between 7.5 and 9.5 months after treatment termination, when mice were 9 to 11 months old. The difference in tumorigenesis was estimated to be statistically significant by the two-sided Fisher’s exact test (P = 0.0006). (B) Representative pictures of tumors growing subcutaneously in NSG mice after injection of cells infected with control shRNA lentivirus (Luc-sh), Bmi1-sh1, and Bmi1-sh2. Three mice were injected on each flank with each lentiviral construct (n = 6 measurements, two per mouse). The mean weight and P values, analyzed by a two-sided Welch’s test, are indicated. There was no difference between Bmi1-sh1 and Bmi1-sh2 (P = 0.681). (C) Tumor size was measured with calipers at 10, 20, and 30 days after injection of cells infected with control shRNA lentivirus (Luc-sh), Bmi1-sh1, or Bmi1-sh2 into immunocompromised mice (three mice per lentiviral construct; mice were injected on both flanks, n = 6). The figure indicates the tumor burden volume versus time since injection (in days). Data normalized to tumor size at day 10 are shown for each time point. At day 30, each of the Bmi1-sh constructs was significantly different from controls, using a two-sided Welch’s t test. In the control animals, tumor burden was 4.95 times that of day 10, compared to 1.69 times that of day 10 for Bmi1-sh1 (P = 0.0036), and 1.77 times that of day 10 for Bmi1-sh2 (P = 0.033). There was no difference between Bmi1-sh1 and Bmi1-sh2 (P = 0.453). (D) Tumor size was measured with calipers at 10, 20, and 30 days after injection of GFP+-sorted cells infected with control retrovirus (MSCV) or C/EBPα-expressing retrovirus (MSCV-C/EBPα) into immunocompromised mice (n = 3 mice per retroviral construct). The figure indicates tumor burden versus time since injection (in days). Data normalized to tumor size at day 10 are shown for each time point. The P value is indicated in the figure, as calculated by the Welch’s two-sided t test.

