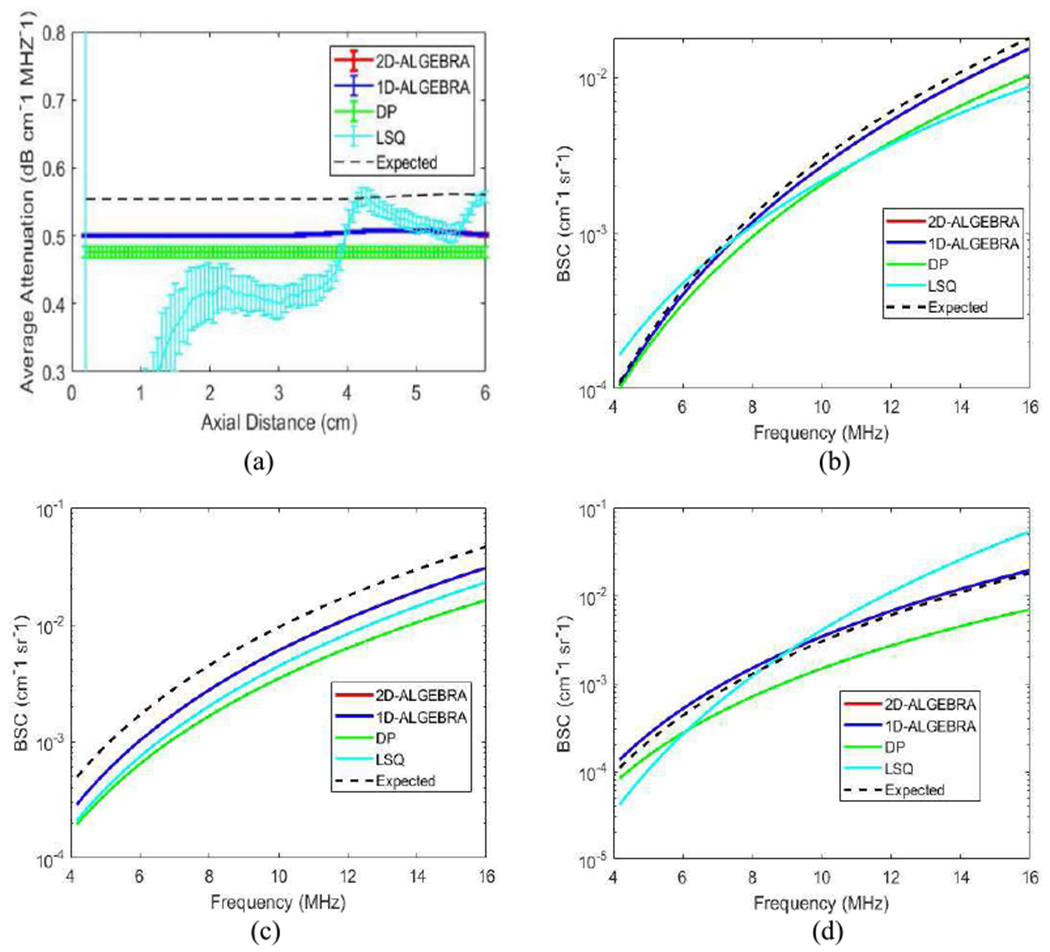
Fig. 6.

Results of 1D-ALGEBRA (blue), 2D-ALGEBRA (red), DP (green), and LSQ (cyan) in phantom D (backscatter step). The error bars show the standard deviation over the 860 samples for the average attenuation (a) and reconstructed backscatter coefficient averaged over 400 samples in layer 1 (b), layer 2 (c), layer 3 (d). The black dashed line is the expected value. The red curve is superimposed by the blue curve.
