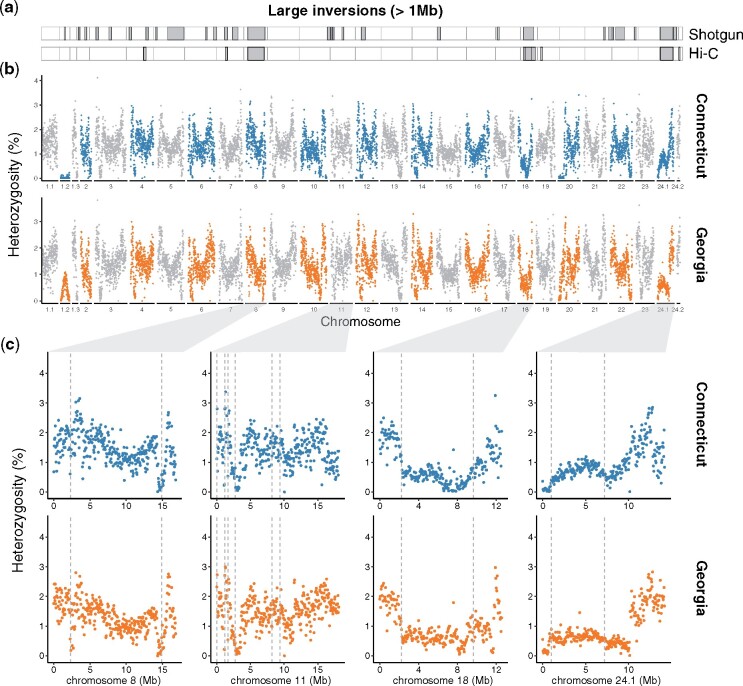
Fig. 2.
The genomic landscape of structural and sequence variation in Connecticut and Georgia. (a) Large inversions (> 1 Mb) as identified from shotgun and Hi-C data from two different individuals from Connecticut mapped to the reference genome from Georgia. (b) Manhattan plots showing the genomic landscape of variation in heterozygosity in 50 kb moving windows across single genomes from Connecticut and Georgia where the alternating colors are used to distinguish adjacent chromosomes. The three and two scaffolds making up chromosomes 1 and 24, respectively, are represented separately here and denoted by decimal suffixes. (c) Enlarged Manhattan plots for each of the four chromosomes with large haploblocks and inversions. Dashed vertical line represents the breakpoints of the large inversions as identified by Delly2 with the shotgun data.

