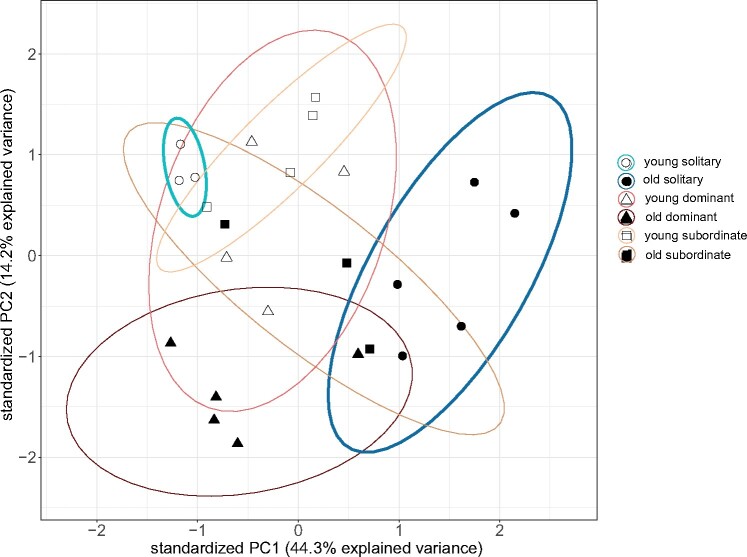
Fig. 2.
Principal component analysis (PCA) of variance-stabilized RNA read counts of young and old Euglossa viridissima females from solitary and social nests. Each point represents the expression profile of one individual across the 1,015 genes which were differentially expressed between young and old individuals, cumulative across all social types (solitary: 902 DEGs, dominant: 100 DEGs, subordinate: 13 DEGs, with five DEGs shared between solitary and subordinate, seven DEGs shared between solitary and dominant, and one DEG shared between dominant and subordinate, see figs. 3 and 4). Axis labels indicate the amount of variance in gene expression explained by the first two principal components (PC1 and PC2). Ellipses represent 95% confidence levels, and colors further illustrate the social type and age of each individual as in figure 1. For solitary females, gene expression profiles did not overlap between young and old individuals (thicker ellipses shown in blue) unlike for dominant or subordinate females.

