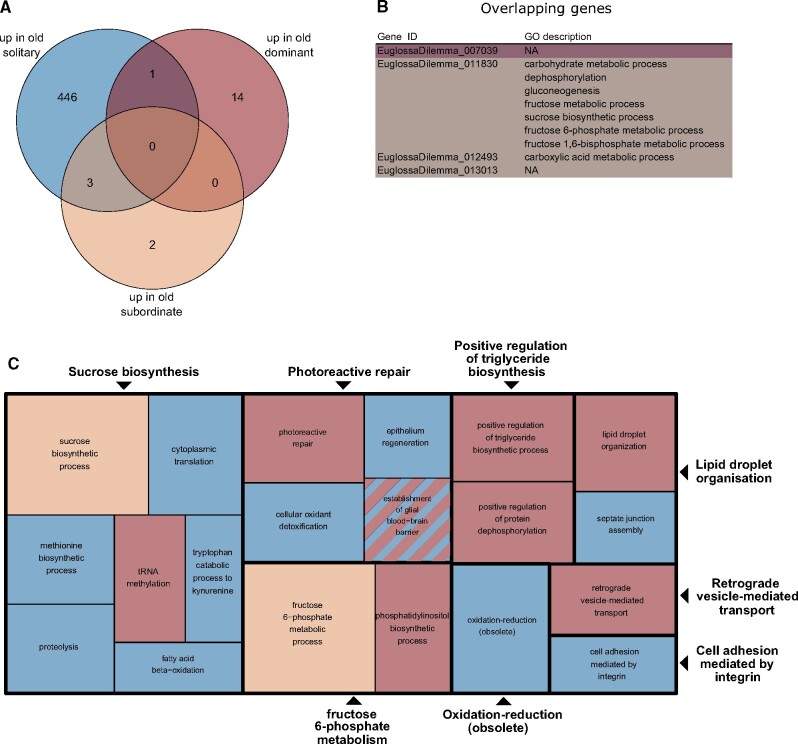
Fig. 4.
Venn diagram (A) and gene ontology (GO) annotations (B and C) for genes upregulated in old solitary, dominant, and subordinate Euglossa viridissima females (i.e., genes upregulated with age). Available GO annotations on the level of Biological Process for genes differentially expressed in multiple comparisons are shown in (B) (NA, GO annotations not available), with colors corresponding to the different comparisons as in the Venn diagram (dark purple, up in old solitary/dominant; brown, up in old solitary/subordinate). A reduced visualization of enriched GO terms for genes upregulated in the different comparisons is shown in (C), with GO terms clustered based on semantic similarity. Comparisons are color-coded as in (A). Each box represents a semantic cluster, and the size of each box is inversely proportional to the adjusted P value for the enrichment of GO terms within its cluster. Boxes outlined in bold represent “superclusters” of loosely related GO terms. Three singletons are represented in their own boxes, as they were not assigned to any supercluster.

