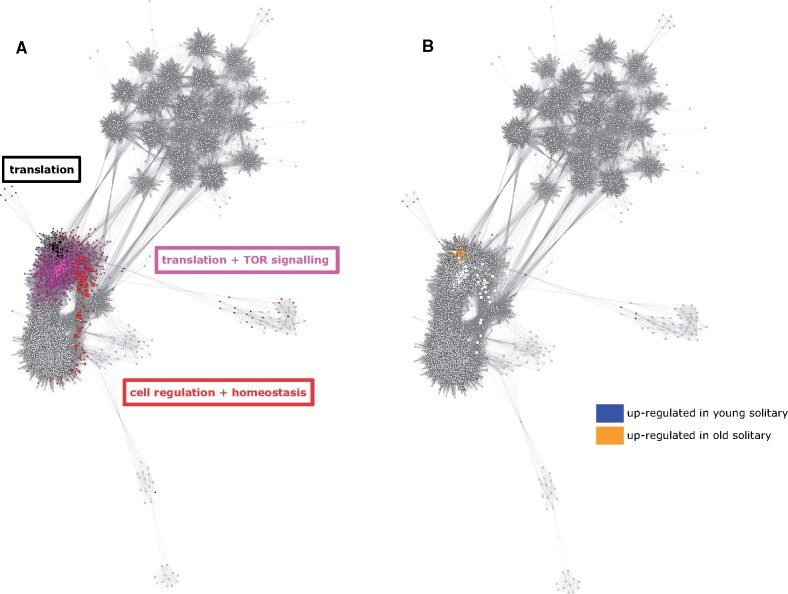
Fig. 5.
Weighted gene coexpression networks across all expressed genes in Euglossa viridissima. Colored nodes in (A) represent all genes from the three age-associated modules (black, magenta, red), with each color representing a different module. Square nodes represent hub genes (intramodular connectivity >0.75). Framed words indicate the top functions of the hub (most highly connected) genes in each module. In (B), colored nodes represent genes from modules in (A) which were differentially expressed between young and old solitary females (blue, upregulated in young; orange, upregulated in old). Colored nodes in network B thus highlight the overlap between the genes found to be significantly associated with age in each independent analysis, that is, the coexpression network analysis and differential gene expression analysis. A reduced version of the network is presented here for visualization purposes, with 6,131 nodes and approximately 600,000 edges.

