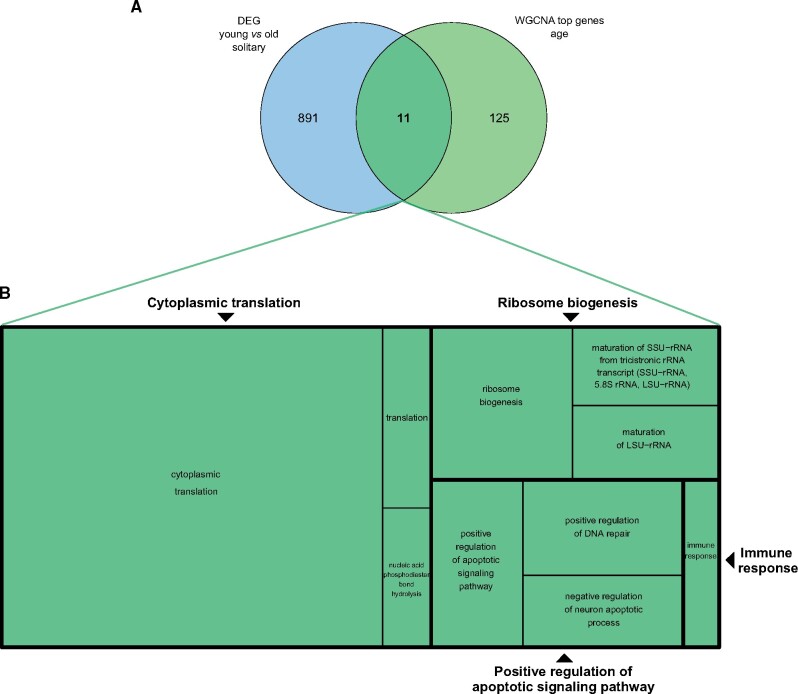
Fig. 6.
Venn diagram (A) and gene ontology (GO) enrichment (B) for genes differentially expressed between young and old solitary Euglossa viridissima females and that were significantly associated with age in solitary females in the weighted gene coexpression network (WGCNA). The light green circle in (A) represents the cumulative 136 hub genes (intramodular connectivity >0.75) across all four age-related modules in the WGCNA. The blue circle shows the number of DEGs between young and old solitary females. A reduced visualization of GO terms which were significantly enriched (adjusted P value <0.1) among the 11 genes shown in bold (intersection in the Venn diagram), which were found to be significantly associated with age in solitary females in both the DEG and the WGCN analyses, is shown in (B), with GO terms clustered based on semantic similarity. Each box represents a semantic cluster, and the size of each box is inversely proportional to the adjusted P value for the enrichment of GO terms within its cluster. Boxes outlined in bold represent “superclusters” of loosely related GO terms. One singleton is represented in its own box, as it was not assigned to any supercluster.

