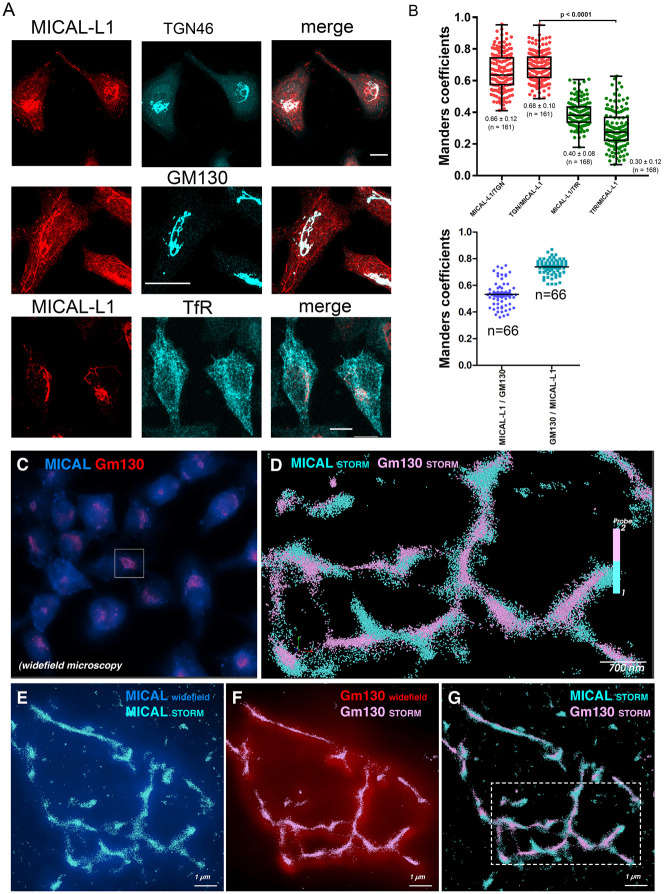
Fig. 2.
Intracellular localization of MICAL-L1. (A) Coverslips of HeLa cells were processed for immunofluorescence using rabbit affinity purified anti-MICAL-L1 and sheep monoclonal anti-TGN46, mouse monoclonal anti-GM130, and mouse anti-transferrin receptor (TfR) antibodies. 3D-projections of confocal images were collected. The projections were combined into a single color image in the third column (merge). Scale bars: 5 µm. (B) Quantification of MICAL-L1/TGN46, MICAL-L1/ GM130 and MICAL-L1/TfR colocalization was evaluated using coloc2 ImageJ plugin, n=numbers of cells analyzed are indicated on the figure. STORM Microscopy (C–G). HeLa cells labelled with anti-MICAL-L1-AlexaFluor647 and anti-GM130-AlexaFluor568. GA can be identified in wide-field microscopy (C) and then super-resolved using STORM (D–G). 3D STORM microscopy through 1 micron depth thanks to biplane module allowed visualization of single molecules MICAL-L1 (cyan sphere) and Gm130 (pink sphere). After several thousand pictures, 3D Golgi stacks can be reconstructed (G; magnified in D).

