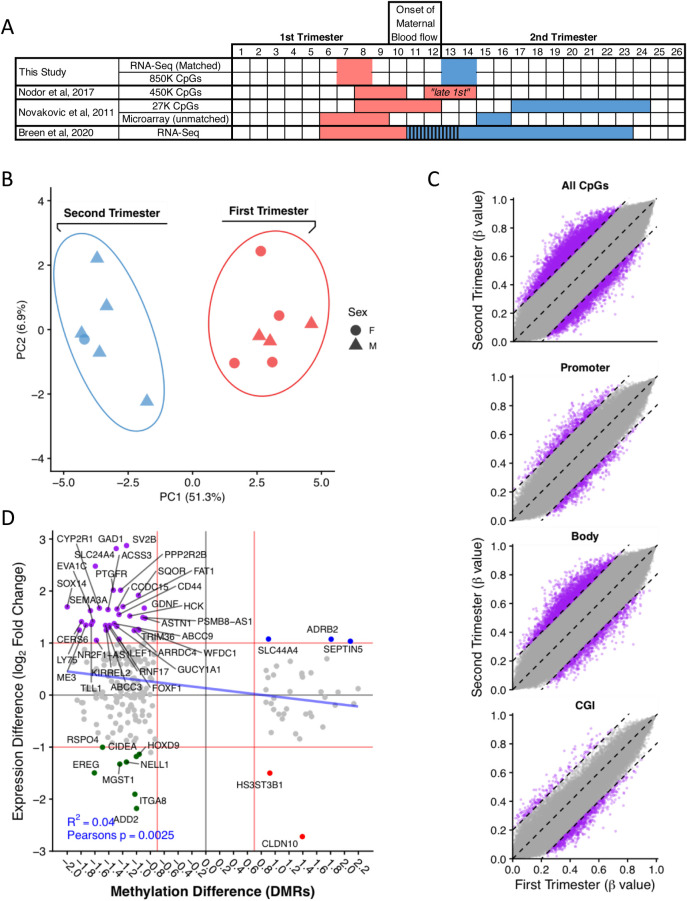
Fig. 5.
DNA methylation changes in first versus second trimester. (A) Comparison of gestational ages between this and related studies. (B) PCA shows clear separation between the first and second trimesters. (C) Global methylation levels are higher in the second trimester as indicated by a shift in points towards the top left. Methylation difference thresholds of 0.2 (20%) and 0.4 (40%) (dashed lines). At specific genomic features, the largest difference is observed at gene bodies with higher methylation during the second trimester, with increased numbers of probes with a methylation difference of over 0.2 (dashed lines). (D) Comparing RNA expression and DNA methylation at promoters and gene bodies shows correlation of reduced expression with increased methylation from first to second trimester for 36 genes (purple). Thresholds of log2 onefold change and a methylation difference of 0.75 (red line).

