
FIGURE 3.
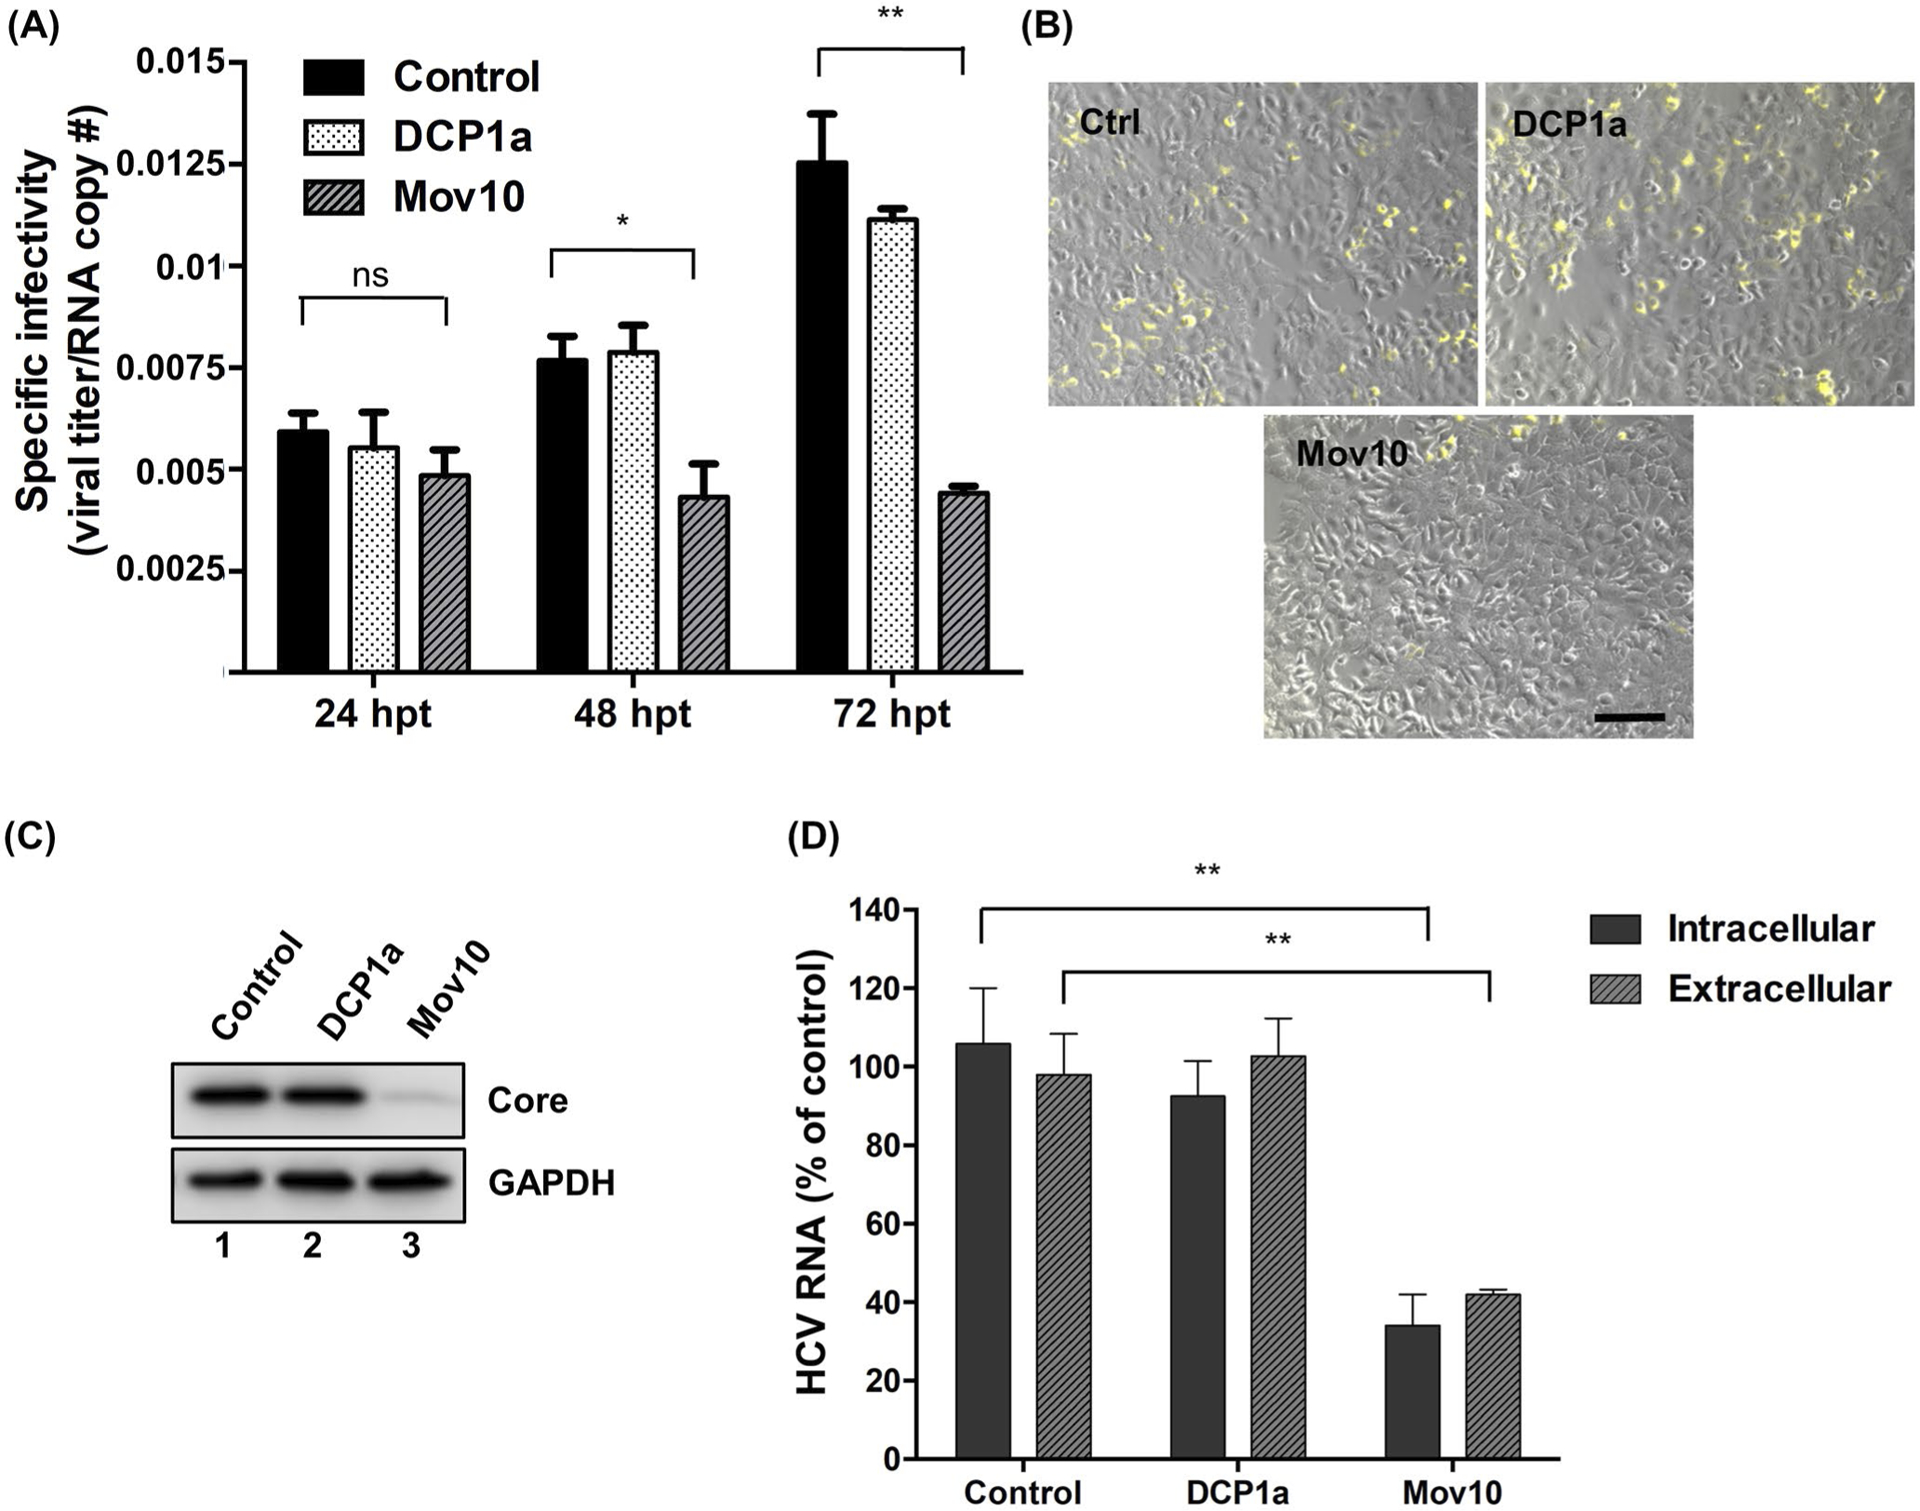
HCV virus produced in Mov10 overexpressing cells has decreased specific infectivity and the infectivity of released virus. Jc1-378-1-Ypet RNA (10 μg) was electroporated into Huh7.5.1 cells. About 16 hpe cells were transfected with either empty plasmid (control), or a plasmid expressing 0.4 μg of FLAG-DCP1a or FLAG-Mov10. Virus containing supernatants were collected at 24, 48, and 72 hpt. A, Specific infectivity was determined by quantifying the number of HCV genome copies by RT-qPCR and the HCV titer by limiting dilution assay. The TCID50/mL values were determined as described in Materials and Methods. Specific infectivity is expressed as the ratio of infectious units to genome copies. B, Virus containing supernatants collected from cells overexpressing Mov10, DCP1a, were normalized for total virus by RT-qPCR (6.25 × 10³ HCV RNA copy numbers). A 72 hpi cells were imaged by fluorescent microscopy following HCV NS5A-Ypet (yellow) expression (representative pictures are shown). Scale bar represents 100 μm. After imaging, cells were collected into two portions. C, The first portion was probed for HCV core protein levels (and GAPDH as a loading control) by Western blot analysis. D, Total RNA was extracted from cells and supernatant of the second portion and analyzed by RT-qPCR for HCV RNA levels. Data were normalized to data for the empty plasmid control. Each data point represents average value of 2 individual experiments. Error bars represent SD